29
/es/
es
AIzaSyAYiBZKx7MnpbEhh9jyipgxe19OcubqV5w
April 1, 2024
204128
Myanmar
MMR
true
2
1
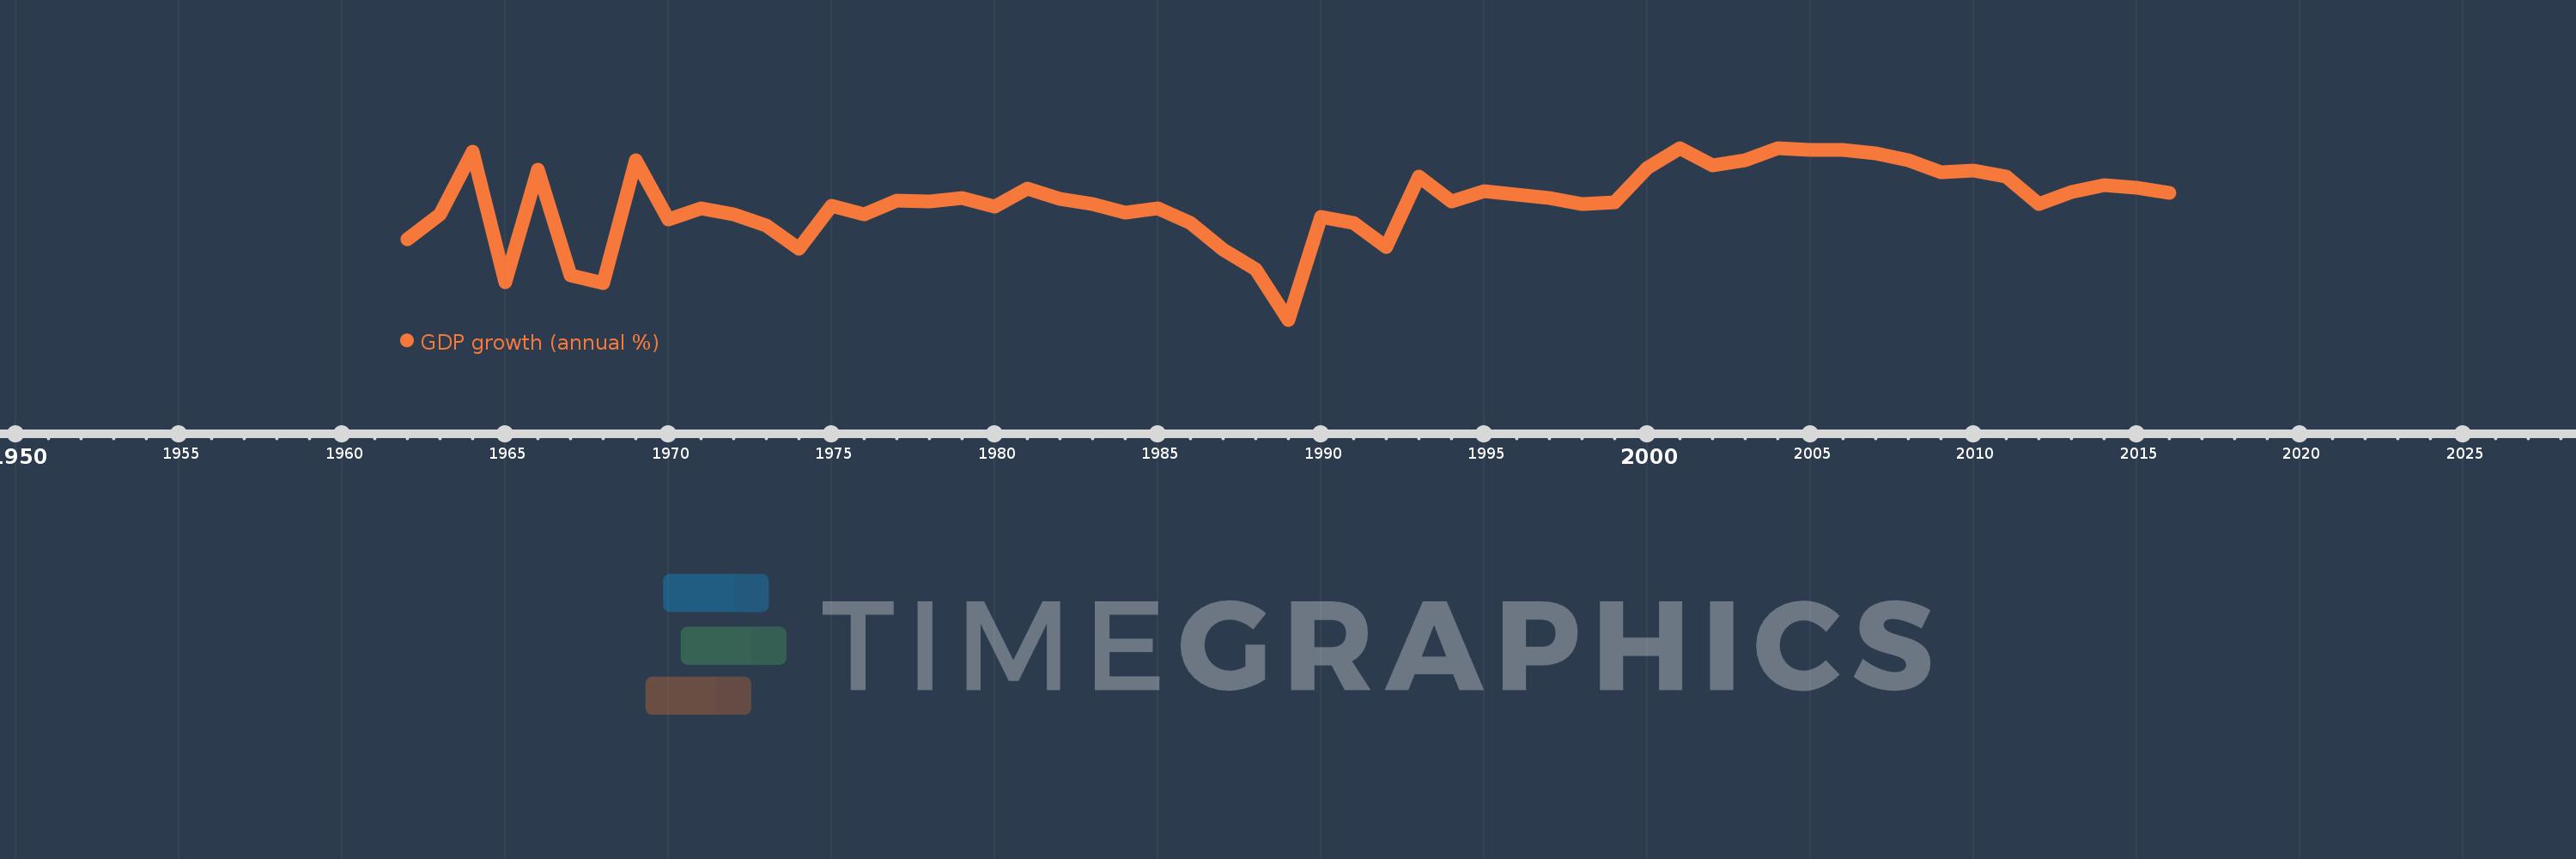
GDP growth (annual %)
2016,2015,2014,2013,2012,2011,2010,2009,2008,2007,2006,2005,2004,2003,2002,2001,2000,1999,1998,1997,1996,1995,1994,1993,1992,1991,1990,1989,1988,1987,1986,1985,1984,1983,1982,1981,1980,1979,1978,1977,1976,1975,1974,1973,1972,1971,1970,1969,1968,1967,1966,1965,1964,1963,1962
Estas estadísticas en otros países:
AfghanistanAlbaniaAlgeriaAndorraAngolaAntigua and BarbudaArab WorldArgentinaArmeniaArubaAustraliaAustriaAzerbaijanBahamas, TheBahrainBangladeshBarbadosBelarusBelgiumBelizeBeninBermudaBhutanBoliviaBosnia and HerzegovinaBotswanaBrazilBrunei DarussalamBulgariaBurkina FasoBurundiCabo VerdeCambodiaCameroonCanadaCaribbean small statesCayman IslandsCentral African RepublicCentral Europe and the BalticsChadChannel IslandsChileChinaColombiaComorosCongo, Dem. Rep.Congo, Rep.Costa RicaCote d'IvoireCroatiaCubaCyprusCzech RepublicDenmarkDjiboutiDominicaDominican RepublicEarly-demographic dividendEast Asia & PacificEast Asia & Pacific (excluding high income)East Asia & Pacific (IDA & IBRD countries)EcuadorEgypt, Arab Rep.El SalvadorEquatorial GuineaEritreaEstoniaEthiopiaEuro areaEurope & Central AsiaEurope & Central Asia (excluding high income)Europe & Central Asia (IDA & IBRD countries)European UnionFijiFinlandFragile and conflict affected situationsFranceFrench PolynesiaGabonGambia, TheGeorgiaGermanyGhanaGreeceGreenlandGrenadaGuatemalaGuineaGuinea-BissauGuyanaHaitiHeavily indebted poor countries (HIPC)High incomeHondurasHong Kong SAR, ChinaHungaryIBRD onlyIcelandIDA & IBRD totalIDA blendIDA onlyIDA totalIndiaIndonesiaIran, Islamic Rep.IraqIrelandIsle of ManIsraelItalyJamaicaJapanJordanKazakhstanKenyaKiribatiKorea, Rep.KosovoKuwaitKyrgyz RepublicLao PDRLate-demographic dividendLatin America & Caribbean Latin America & Caribbean (excluding high income)Latin America & the Caribbean (IDA & IBRD countries)LatviaLeast developed countries: UN classificationLebanonLesothoLiberiaLibyaLiechtensteinLithuaniaLow & middle incomeLow incomeLower middle incomeLuxembourgMacao SAR, ChinaMacedonia, FYRMadagascarMalawiMalaysiaMaldivesMaliMaltaMarshall IslandsMauritaniaMauritiusMexicoMicronesia, Fed. Sts.Middle East & North AfricaMiddle East & North Africa (excluding high income)Middle East & North Africa (IDA & IBRD countries)Middle incomeMoldovaMonacoMongoliaMontenegroMoroccoMozambiqueMyanmarNamibiaNauruNepalNetherlandsNew CaledoniaNew ZealandNicaraguaNigerNigeriaNorth AmericaNorwayOECD membersOmanOther small statesPacific island small statesPakistanPalauPanamaPapua New GuineaParaguayPeruPhilippinesPolandPortugalPost-demographic dividendPre-demographic dividendPuerto RicoQatarRomaniaRussian FederationRwandaSamoaSan MarinoSao Tome and PrincipeSaudi ArabiaSenegalSerbiaSeychellesSierra LeoneSingaporeSlovak RepublicSloveniaSmall statesSolomon IslandsSomaliaSouth AfricaSouth AsiaSouth Asia (IDA & IBRD)South SudanSpainSri LankaSt. Kitts and NevisSt. LuciaSt. Vincent and the GrenadinesSub-Saharan Africa Sub-Saharan Africa (excluding high income)Sub-Saharan Africa (IDA & IBRD countries)SudanSurinameSwazilandSwedenSwitzerlandSyrian Arab RepublicTajikistanTanzaniaThailandTimor-LesteTogoTongaTrinidad and TobagoTunisiaTurkeyTurkmenistanTuvaluUgandaUkraineUnited Arab EmiratesUnited KingdomUnited StatesUpper middle incomeUruguayUzbekistanVanuatuVenezuela, RBVietnamVirgin Islands (U.S.)West Bank and GazaWorldYemen, Rep.ZambiaZimbabwe línea de tiempo (timeline):
En esta escala de tiempo se presenta un gráfico de 1962 y 2016 de Myanmar. Los datos de 1961 están ausentes. El número de observaciones reales por fecha: 55.
Fuente (nombre):
Indicadores del desarrollo mundial
Fuente (organización):
World Bank national accounts data, and OECD National Accounts data files.
Categorías:
Economy & Growth
Se ha actualizado:
23 abr 2017 año
Los indicadores de los cambios de valor en los últimos años
Mínimo:
-11.352
1 ene 1989 año
Máximo:
13.844
1 ene 2004 año
A la fecha de observación
Valor
Cambio absoluto
El cambio con respecto al valor anterior
1 ene 1962 año
0.472
+0.472
0.0%
1 ene 1963 año
4.087
+3.615
766.67%
1 ene 1964 año
13.349
+9.262
226.64%
1 ene 1965 año
-5.894
-19.243
-144.15%
1 ene 1966 año
10.693
+16.587
-281.42%
1 ene 1967 año
-4.852
-15.544
-145.37%
1 ene 1968 año
-5.925
-1.073
22.13%
1 ene 1969 año
12.059
+17.985
-303.52%
1 ene 1970 año
3.292
-8.768
-72.7%
1 ene 1971 año
4.979
+1.688
51.27%
1 ene 1972 año
4.13
-0.849
-17.06%
1 ene 1973 año
2.436
-1.694
-41.02%
1 ene 1974 año
-0.968
-3.404
-139.74%
1 ene 1975 año
5.342
+6.311
-651.83%
1 ene 1976 año
4.153
-1.19
-22.27%
1 ene 1977 año
6.08
+1.928
46.42%
1 ene 1978 año
5.952
-0.128
-2.11%
1 ene 1979 año
6.518
+0.566
9.5%
1 ene 1980 año
5.201
-1.317
-20.2%
1 ene 1981 año
7.939
+2.737
52.63%
1 ene 1982 año
6.356
-1.583
-19.94%
1 ene 1983 año
5.604
-0.752
-11.83%
1 ene 1984 año
4.391
-1.213
-21.64%
1 ene 1985 año
4.933
+0.542
12.33%
1 ene 1986 año
2.851
-2.082
-42.2%
1 ene 1987 año
-1.057
-3.908
-137.09%
1 ene 1988 año
-4.006
-2.948
278.84%
1 ene 1989 año
-11.352
-7.347
183.41%
1 ene 1990 año
3.695
+15.048
-132.55%
1 ene 1991 año
2.817
-0.878
-23.77%
1 ene 1992 año
-0.651
-3.468
-123.1%
1 ene 1993 año
9.661
+10.312
-1.58 mil%
1 ene 1994 año
6.039
-3.622
-37.49%
1 ene 1995 año
7.478
+1.439
23.82%
1 ene 1996 año
6.948
-0.53
-7.09%
1 ene 1997 año
6.443
-0.505
-7.27%
1 ene 1998 año
5.652
-0.791
-12.28%
1 ene 1999 año
5.866
+0.215
3.8%
1 ene 2000 año
10.945
+5.079
86.58%
1 ene 2001 año
13.746
+2.801
25.59%
1 ene 2002 año
11.344
-2.402
-17.47%
1 ene 2003 año
12.026
+0.682
6.01%
1 ene 2004 año
13.844
+1.818
15.12%
1 ene 2005 año
13.565
-0.279
-2.02%
1 ene 2006 año
13.569
+0.004
0.03%
1 ene 2007 año
13.076
-0.493
-3.63%
1 ene 2008 año
11.991
-1.085
-8.3%
1 ene 2009 año
10.255
-1.736
-14.48%
1 ene 2010 año
10.55
+0.295
2.87%
1 ene 2011 año
9.634
-0.916
-8.68%
1 ene 2012 año
5.591
-4.043
-41.96%
1 ene 2013 año
7.333
+1.741
31.14%
1 ene 2014 año
8.426
+1.093
14.91%
1 ene 2015 año
7.991
-0.435
-5.16%
1 ene 2016 año
7.294
-0.697
-8.72%
Ranking de los países por los datos estadísticos actuales


Comentarios: