29
/es/
es
AIzaSyAYiBZKx7MnpbEhh9jyipgxe19OcubqV5w
April 1, 2024
82574
Belize
BLZ
true
2
1
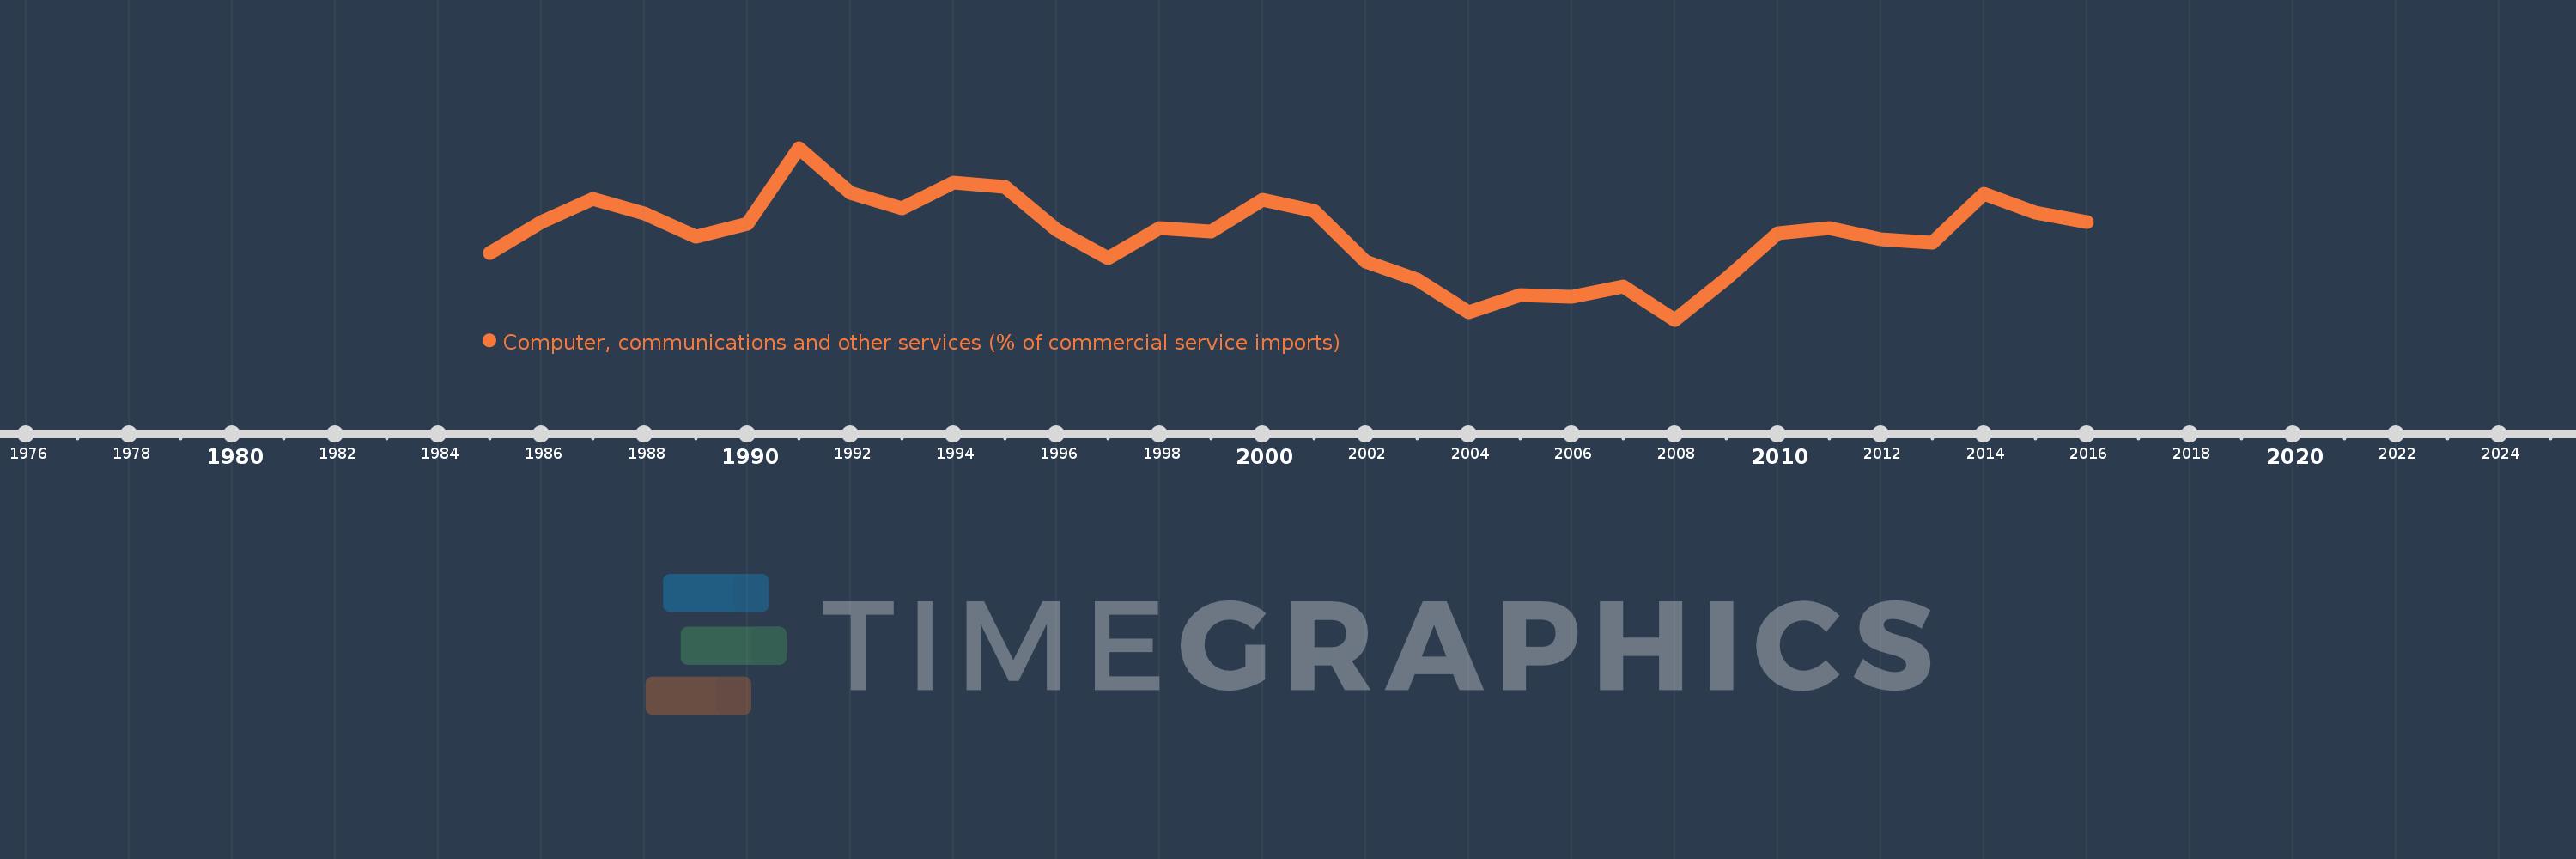
Computer, communications and other services (% of commercial service imports)
2016,2015,2014,2013,2012,2011,2010,2009,2008,2007,2006,2005,2004,2003,2002,2001,2000,1999,1998,1997,1996,1995,1994,1993,1992,1991,1990,1989,1988,1987,1986,1985
Estas estadísticas en otros países:
AfghanistanAlbaniaAlgeriaAngolaAntigua and BarbudaArab WorldArgentinaArmeniaArubaAustraliaAustriaAzerbaijanBahamas, TheBahrainBangladeshBarbadosBelarusBelgiumBelizeBeninBermudaBhutanBoliviaBosnia and HerzegovinaBotswanaBrazilBrunei DarussalamBulgariaBurkina FasoBurundiCabo VerdeCambodiaCameroonCanadaCaribbean small statesCentral African RepublicCentral Europe and the BalticsChadChileChinaColombiaComorosCongo, Dem. Rep.Congo, Rep.Costa RicaCote d'IvoireCroatiaCuracaoCyprusCzech RepublicDenmarkDjiboutiDominicaDominican RepublicEarly-demographic dividendEast Asia & PacificEast Asia & Pacific (excluding high income)East Asia & Pacific (IDA & IBRD countries)EcuadorEgypt, Arab Rep.El SalvadorEquatorial GuineaEritreaEstoniaEthiopiaEuro areaEurope & Central AsiaEurope & Central Asia (excluding high income)Europe & Central Asia (IDA & IBRD countries)European UnionFaroe IslandsFijiFinlandFragile and conflict affected situationsFranceFrench PolynesiaGabonGambia, TheGeorgiaGermanyGhanaGreeceGrenadaGuatemalaGuineaGuinea-BissauGuyanaHaitiHeavily indebted poor countries (HIPC)High incomeHondurasHong Kong SAR, ChinaHungaryIBRD onlyIcelandIDA & IBRD totalIDA onlyIDA totalIndiaIndonesiaIran, Islamic Rep.IraqIrelandIsraelItalyJamaicaJapanJordanKazakhstanKenyaKiribatiKorea, Rep.KosovoKuwaitKyrgyz RepublicLao PDRLate-demographic dividendLatin America & Caribbean Latin America & Caribbean (excluding high income)Latin America & the Caribbean (IDA & IBRD countries)LatviaLeast developed countries: UN classificationLebanonLesothoLiberiaLibyaLithuaniaLow & middle incomeLow incomeLower middle incomeLuxembourgMacao SAR, ChinaMacedonia, FYRMadagascarMalawiMalaysiaMaldivesMaliMaltaMarshall IslandsMauritaniaMauritiusMexicoMicronesia, Fed. Sts.Middle East & North AfricaMiddle East & North Africa (excluding high income)Middle East & North Africa (IDA & IBRD countries)Middle incomeMoldovaMongoliaMontenegroMoroccoMozambiqueMyanmarNamibiaNepalNetherlandsNew CaledoniaNew ZealandNicaraguaNigerNigeriaNorth AmericaNorwayOECD membersOmanOther small statesPacific island small statesPakistanPalauPanamaPapua New GuineaParaguayPeruPhilippinesPolandPortugalPost-demographic dividendPre-demographic dividendQatarRomaniaRussian FederationRwandaSamoaSao Tome and PrincipeSaudi ArabiaSenegalSerbiaSeychellesSierra LeoneSingaporeSint Maarten (Dutch part)Slovak RepublicSloveniaSmall statesSolomon IslandsSouth AfricaSouth AsiaSouth Asia (IDA & IBRD)South SudanSpainSri LankaSt. Kitts and NevisSt. LuciaSt. Vincent and the GrenadinesSub-Saharan Africa Sub-Saharan Africa (excluding high income)Sub-Saharan Africa (IDA & IBRD countries)SudanSurinameSwazilandSwedenSwitzerlandSyrian Arab RepublicTajikistanTanzaniaThailandTimor-LesteTogoTongaTrinidad and TobagoTunisiaTurkeyTuvaluUgandaUkraineUnited KingdomUnited StatesUpper middle incomeUruguayVanuatuVenezuela, RBWest Bank and GazaWorldYemen, Rep.ZambiaZimbabwe línea de tiempo (timeline):
En esta escala de tiempo se presenta un gráfico de 1985 y 2016 de Belize. Los datos de 1984 están ausentes. El número de observaciones reales por fecha: 32.
Fuente (nombre):
Indicadores del desarrollo mundial
Fuente (organización):
International Monetary Fund, Balance of Payments Statistics Yearbook and data files.
Categorías:
Private Sector, Trade
Se ha actualizado:
23 abr 2017 año
Los indicadores de los cambios de valor en los últimos años
Mínimo:
11.142
1 ene 2008 año
Máximo:
30.047
1 ene 1991 año
A la fecha de observación
Valor
Cambio absoluto
El cambio con respecto al valor anterior
1 ene 1985 año
18.44
+18.44
0.0%
1 ene 1986 año
21.928
+3.488
18.92%
1 ene 1987 año
24.415
+2.487
11.34%
1 ene 1988 año
22.789
-1.626
-6.66%
1 ene 1989 año
20.314
-2.474
-10.86%
1 ene 1990 año
21.657
+1.342
6.61%
1 ene 1991 año
30.047
+8.39
38.74%
1 ene 1992 año
25.128
-4.918
-16.37%
1 ene 1993 año
23.38
-1.748
-6.96%
1 ene 1994 año
26.214
+2.833
12.12%
1 ene 1995 año
25.745
-0.469
-1.79%
1 ene 1996 año
21.05
-4.694
-18.23%
1 ene 1997 año
17.88
-3.17
-15.06%
1 ene 1998 año
21.224
+3.344
18.7%
1 ene 1999 año
20.842
-0.382
-1.8%
1 ene 2000 año
24.379
+3.537
16.97%
1 ene 2001 año
23.079
-1.301
-5.34%
1 ene 2002 año
17.536
-5.542
-24.01%
1 ene 2003 año
15.572
-1.964
-11.2%
1 ene 2004 año
11.972
-3.601
-23.12%
1 ene 2005 año
13.845
+1.873
15.65%
1 ene 2006 año
13.632
-0.213
-1.54%
1 ene 2007 año
14.805
+1.173
8.6%
1 ene 2008 año
11.142
-3.663
-24.74%
1 ene 2009 año
15.647
+4.505
40.43%
1 ene 2010 año
20.622
+4.975
31.79%
1 ene 2011 año
21.259
+0.637
3.09%
1 ene 2012 año
19.957
-1.303
-6.13%
1 ene 2013 año
19.58
-0.377
-1.89%
1 ene 2014 año
24.995
+5.416
27.66%
1 ene 2015 año
22.894
-2.101
-8.41%
1 ene 2016 año
21.919
-0.975
-4.26%
Ranking de los países por los datos estadísticos actuales


Comentarios: