29
/es/
es
AIzaSyAYiBZKx7MnpbEhh9jyipgxe19OcubqV5w
April 1, 2024
207767
Netherlands
NLD
true
2
1
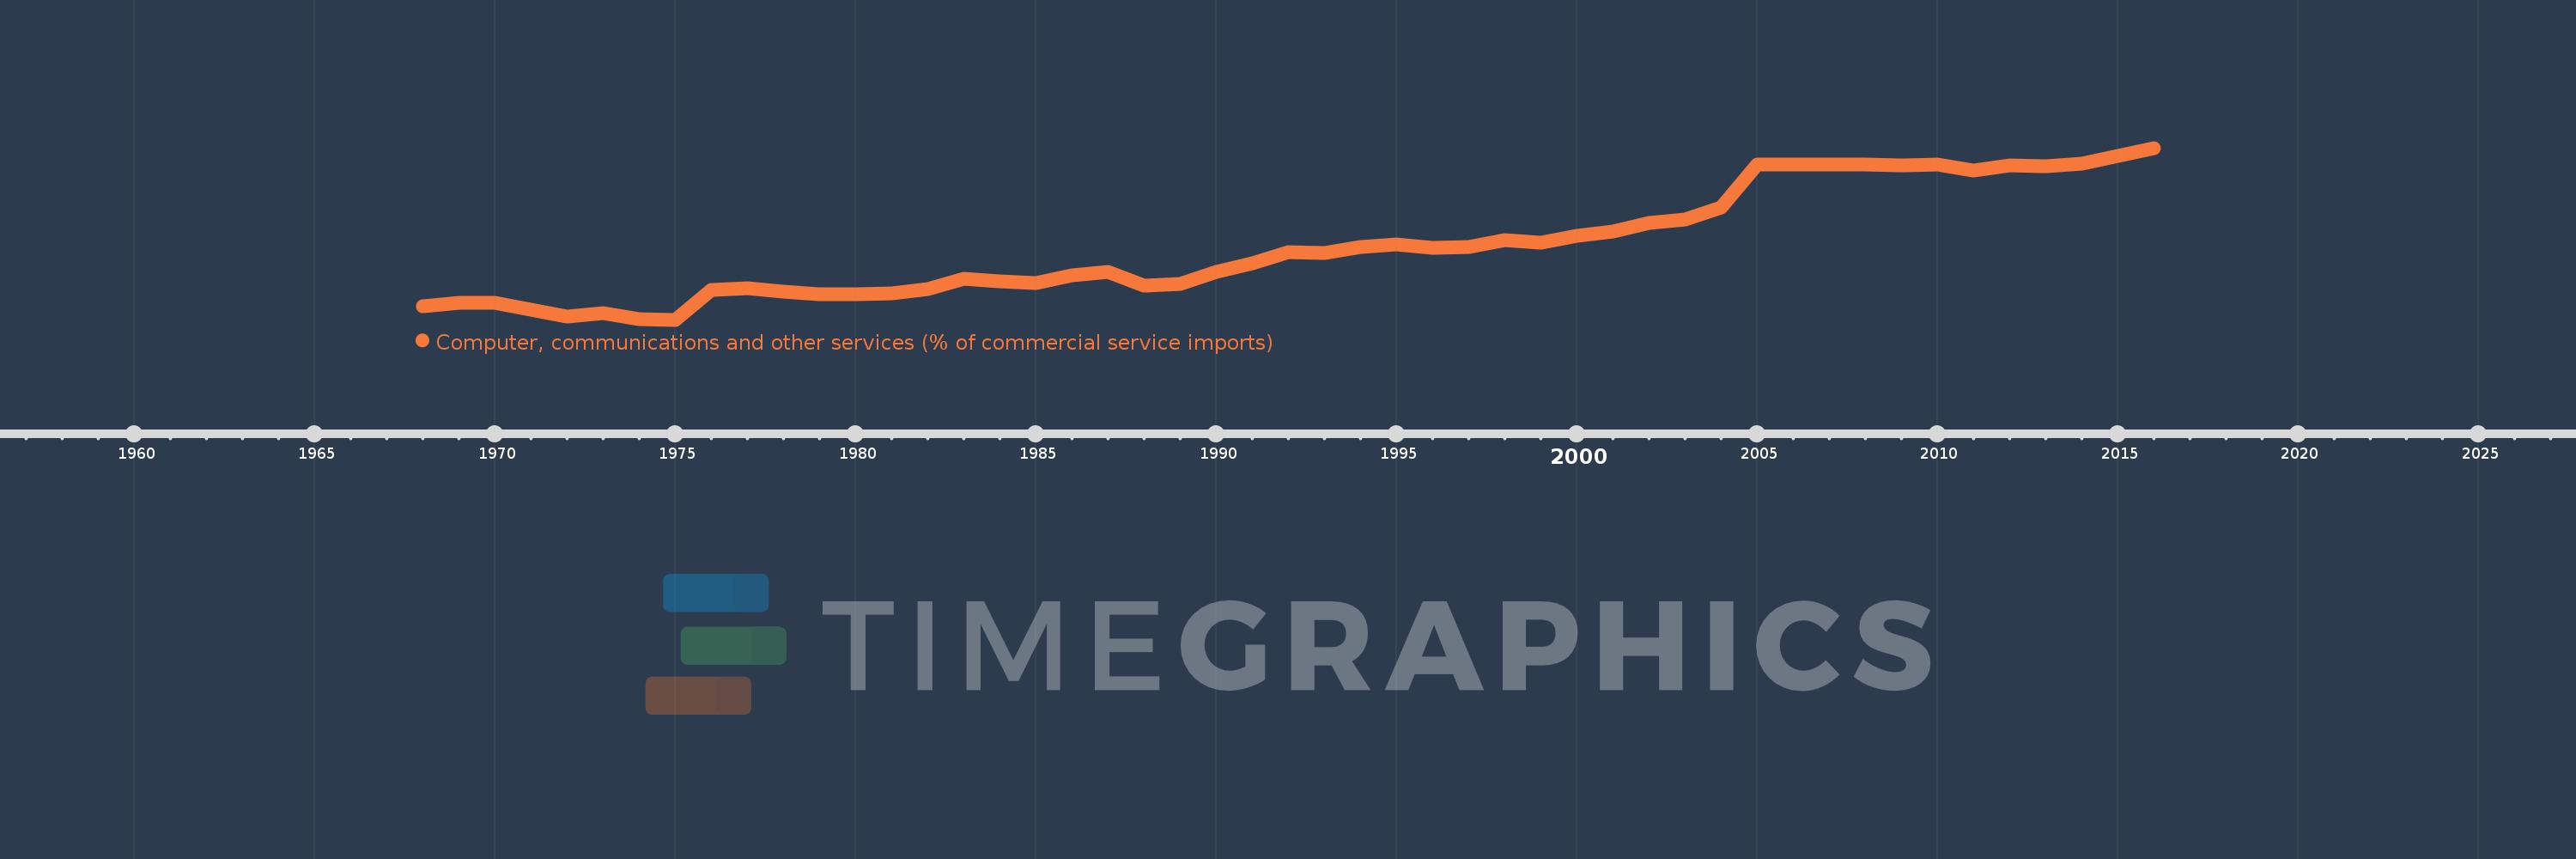
Computer, communications and other services (% of commercial service imports)
2016,2015,2014,2013,2012,2011,2010,2009,2008,2007,2006,2005,2004,2003,2002,2001,2000,1999,1998,1997,1996,1995,1994,1993,1992,1991,1990,1989,1988,1987,1986,1985,1984,1983,1982,1981,1980,1979,1978,1977,1976,1975,1974,1973,1972,1971,1970,1969,1968
Estas estadísticas en otros países:
AfghanistanAlbaniaAlgeriaAngolaAntigua and BarbudaArab WorldArgentinaArmeniaArubaAustraliaAustriaAzerbaijanBahamas, TheBahrainBangladeshBarbadosBelarusBelgiumBelizeBeninBermudaBhutanBoliviaBosnia and HerzegovinaBotswanaBrazilBrunei DarussalamBulgariaBurkina FasoBurundiCabo VerdeCambodiaCameroonCanadaCaribbean small statesCentral African RepublicCentral Europe and the BalticsChadChileChinaColombiaComorosCongo, Dem. Rep.Congo, Rep.Costa RicaCote d'IvoireCroatiaCuracaoCyprusCzech RepublicDenmarkDjiboutiDominicaDominican RepublicEarly-demographic dividendEast Asia & PacificEast Asia & Pacific (excluding high income)East Asia & Pacific (IDA & IBRD countries)EcuadorEgypt, Arab Rep.El SalvadorEquatorial GuineaEritreaEstoniaEthiopiaEuro areaEurope & Central AsiaEurope & Central Asia (excluding high income)Europe & Central Asia (IDA & IBRD countries)European UnionFaroe IslandsFijiFinlandFragile and conflict affected situationsFranceFrench PolynesiaGabonGambia, TheGeorgiaGermanyGhanaGreeceGrenadaGuatemalaGuineaGuinea-BissauGuyanaHaitiHeavily indebted poor countries (HIPC)High incomeHondurasHong Kong SAR, ChinaHungaryIBRD onlyIcelandIDA & IBRD totalIDA onlyIDA totalIndiaIndonesiaIran, Islamic Rep.IraqIrelandIsraelItalyJamaicaJapanJordanKazakhstanKenyaKiribatiKorea, Rep.KosovoKuwaitKyrgyz RepublicLao PDRLate-demographic dividendLatin America & Caribbean Latin America & Caribbean (excluding high income)Latin America & the Caribbean (IDA & IBRD countries)LatviaLeast developed countries: UN classificationLebanonLesothoLiberiaLibyaLithuaniaLow & middle incomeLow incomeLower middle incomeLuxembourgMacao SAR, ChinaMacedonia, FYRMadagascarMalawiMalaysiaMaldivesMaliMaltaMarshall IslandsMauritaniaMauritiusMexicoMicronesia, Fed. Sts.Middle East & North AfricaMiddle East & North Africa (excluding high income)Middle East & North Africa (IDA & IBRD countries)Middle incomeMoldovaMongoliaMontenegroMoroccoMozambiqueMyanmarNamibiaNepalNetherlandsNew CaledoniaNew ZealandNicaraguaNigerNigeriaNorth AmericaNorwayOECD membersOmanOther small statesPacific island small statesPakistanPalauPanamaPapua New GuineaParaguayPeruPhilippinesPolandPortugalPost-demographic dividendPre-demographic dividendQatarRomaniaRussian FederationRwandaSamoaSao Tome and PrincipeSaudi ArabiaSenegalSerbiaSeychellesSierra LeoneSingaporeSint Maarten (Dutch part)Slovak RepublicSloveniaSmall statesSolomon IslandsSouth AfricaSouth AsiaSouth Asia (IDA & IBRD)South SudanSpainSri LankaSt. Kitts and NevisSt. LuciaSt. Vincent and the GrenadinesSub-Saharan Africa Sub-Saharan Africa (excluding high income)Sub-Saharan Africa (IDA & IBRD countries)SudanSurinameSwazilandSwedenSwitzerlandSyrian Arab RepublicTajikistanTanzaniaThailandTimor-LesteTogoTongaTrinidad and TobagoTunisiaTurkeyTuvaluUgandaUkraineUnited KingdomUnited StatesUpper middle incomeUruguayVanuatuVenezuela, RBWest Bank and GazaWorldYemen, Rep.ZambiaZimbabwe línea de tiempo (timeline):
En esta escala de tiempo se presenta un gráfico de 1968 y 2016 de Netherlands. Los datos de 1967 están ausentes. El número de observaciones reales por fecha: 49.
Fuente (nombre):
Indicadores del desarrollo mundial
Fuente (organización):
International Monetary Fund, Balance of Payments Statistics Yearbook and data files.
Categorías:
Private Sector, Trade
Se ha actualizado:
23 abr 2017 año
Los indicadores de los cambios de valor en los últimos años
Mínimo:
20.655
1 ene 1975 año
Máximo:
71.001
1 ene 2016 año
A la fecha de observación
Valor
Cambio absoluto
El cambio con respecto al valor anterior
1 ene 1968 año
24.536
+24.536
0.0%
1 ene 1969 año
25.5
+0.964
3.93%
1 ene 1970 año
25.674
+0.174
0.68%
1 ene 1971 año
23.518
-2.156
-8.4%
1 ene 1972 año
21.537
-1.981
-8.42%
1 ene 1973 año
22.679
+1.142
5.3%
1 ene 1974 año
20.813
-1.866
-8.23%
1 ene 1975 año
20.655
-0.158
-0.76%
1 ene 1976 año
29.305
+8.65
41.88%
1 ene 1977 año
29.826
+0.521
1.78%
1 ene 1978 año
28.982
-0.844
-2.83%
1 ene 1979 año
28.025
-0.957
-3.3%
1 ene 1980 año
28.026
+0.0
0.0%
1 ene 1981 año
28.392
+0.367
1.31%
1 ene 1982 año
29.62
+1.228
4.32%
1 ene 1983 año
32.545
+2.925
9.88%
1 ene 1984 año
31.797
-0.748
-2.3%
1 ene 1985 año
31.429
-0.369
-1.16%
1 ene 1986 año
33.628
+2.199
7.0%
1 ene 1987 año
34.751
+1.124
3.34%
1 ene 1988 año
30.694
-4.057
-11.68%
1 ene 1989 año
31.186
+0.492
1.6%
1 ene 1990 año
34.571
+3.385
10.85%
1 ene 1991 año
37.078
+2.508
7.25%
1 ene 1992 año
40.554
+3.476
9.37%
1 ene 1993 año
40.23
-0.324
-0.8%
1 ene 1994 año
42.063
+1.833
4.56%
1 ene 1995 año
42.784
+0.721
1.71%
1 ene 1996 año
41.759
-1.025
-2.4%
1 ene 1997 año
41.868
+0.11
0.26%
1 ene 1998 año
43.933
+2.064
4.93%
1 ene 1999 año
43.166
-0.767
-1.74%
1 ene 2000 año
45.184
+2.018
4.68%
1 ene 2001 año
46.55
+1.366
3.02%
1 ene 2002 año
49.043
+2.493
5.36%
1 ene 2003 año
50.059
+1.016
2.07%
1 ene 2004 año
53.446
+3.387
6.77%
1 ene 2005 año
66.223
+12.777
23.91%
1 ene 2006 año
66.069
-0.154
-0.23%
1 ene 2007 año
66.124
+0.054
0.08%
1 ene 2008 año
66.179
+0.055
0.08%
1 ene 2009 año
65.983
-0.196
-0.3%
1 ene 2010 año
66.091
+0.108
0.16%
1 ene 2011 año
64.487
-1.604
-2.43%
1 ene 2012 año
65.794
+1.307
2.03%
1 ene 2013 año
65.597
-0.196
-0.3%
1 ene 2014 año
66.477
+0.88
1.34%
1 ene 2015 año
68.727
+2.25
3.38%
1 ene 2016 año
71.001
+2.274
3.31%
Ranking de los países por los datos estadísticos actuales


Comentarios: