29
/es/
es
AIzaSyAYiBZKx7MnpbEhh9jyipgxe19OcubqV5w
April 1, 2024
248474
Sri Lanka
LKA
true
2
1
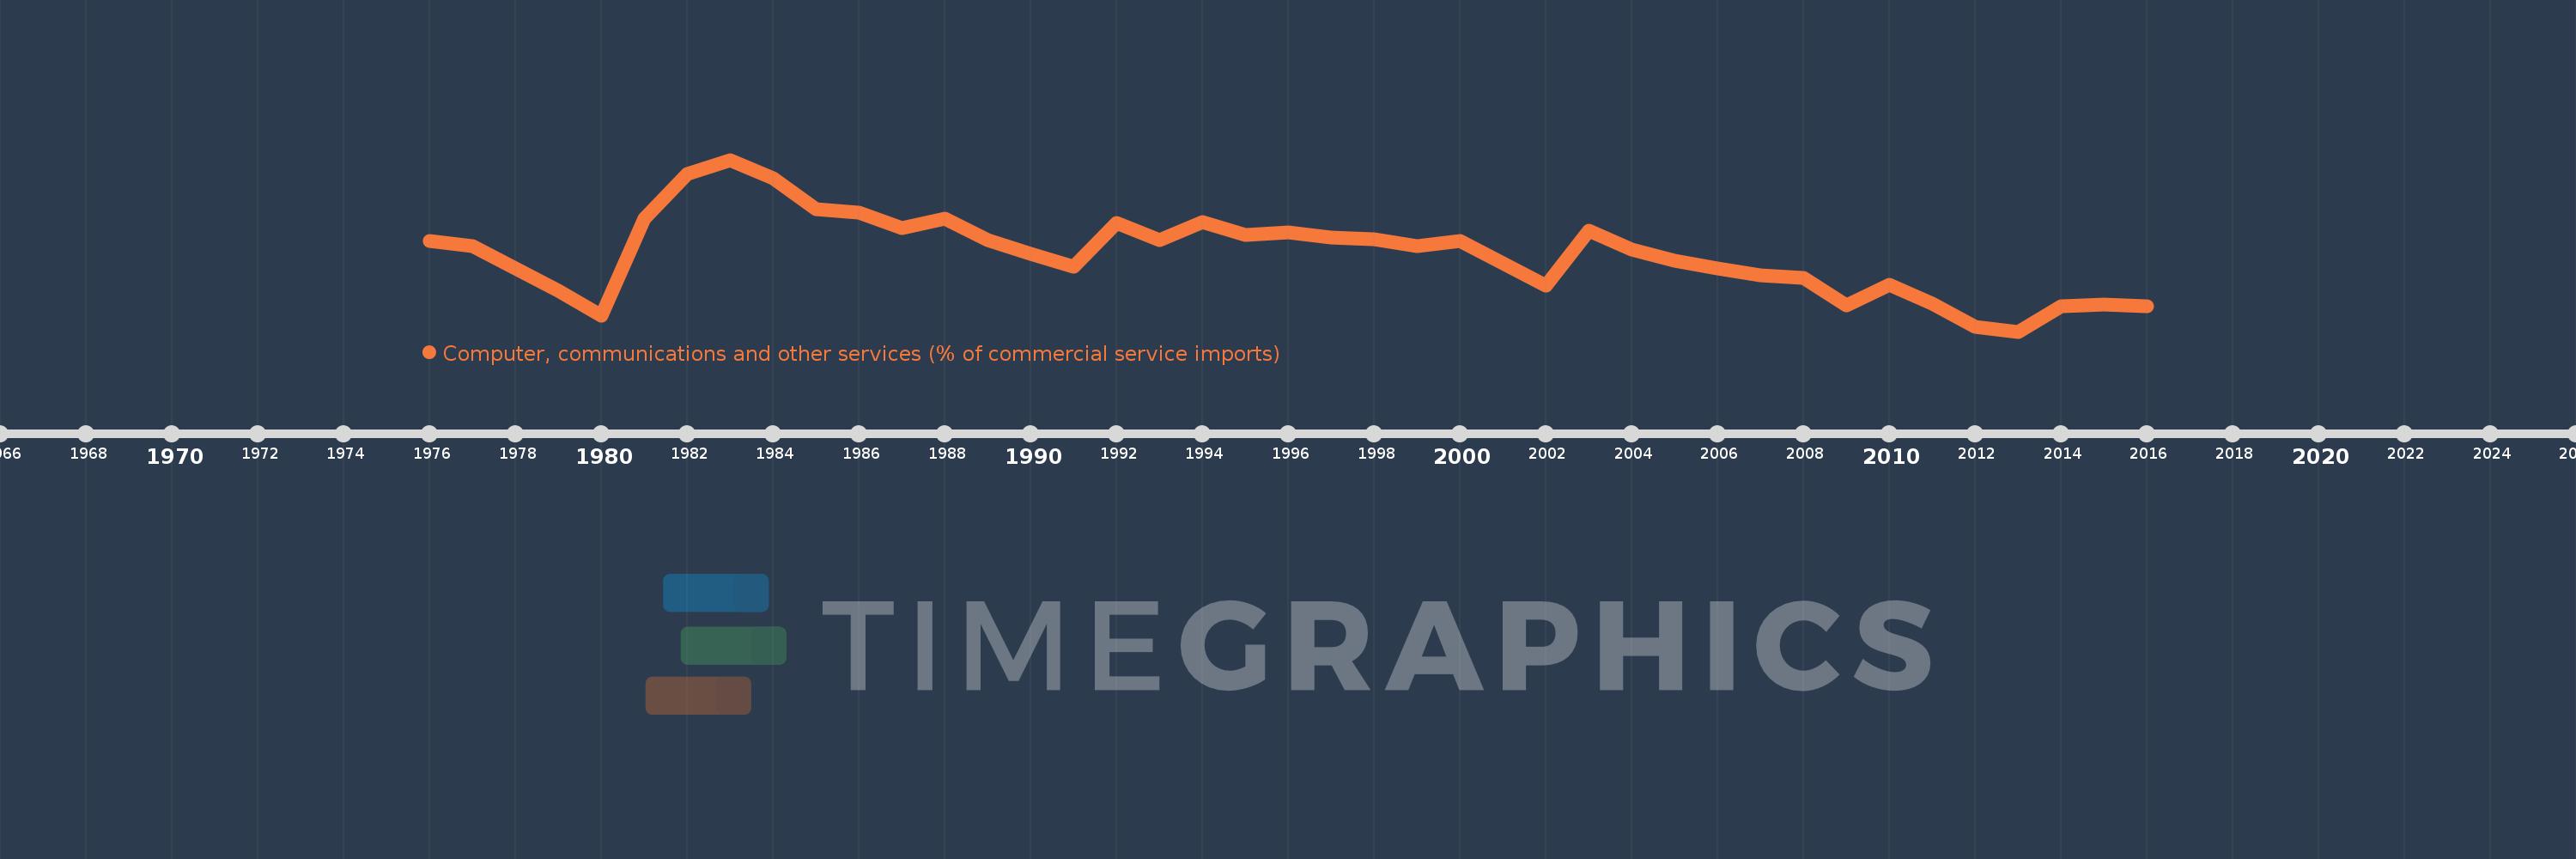
Computer, communications and other services (% of commercial service imports)
2016,2015,2014,2013,2012,2011,2010,2009,2008,2007,2006,2005,2004,2003,2002,2001,2000,1999,1998,1997,1996,1995,1994,1993,1992,1991,1990,1989,1988,1987,1986,1985,1984,1983,1982,1981,1980,1979,1978,1977,1976
Estas estadísticas en otros países:
AfghanistanAlbaniaAlgeriaAngolaAntigua and BarbudaArab WorldArgentinaArmeniaArubaAustraliaAustriaAzerbaijanBahamas, TheBahrainBangladeshBarbadosBelarusBelgiumBelizeBeninBermudaBhutanBoliviaBosnia and HerzegovinaBotswanaBrazilBrunei DarussalamBulgariaBurkina FasoBurundiCabo VerdeCambodiaCameroonCanadaCaribbean small statesCentral African RepublicCentral Europe and the BalticsChadChileChinaColombiaComorosCongo, Dem. Rep.Congo, Rep.Costa RicaCote d'IvoireCroatiaCuracaoCyprusCzech RepublicDenmarkDjiboutiDominicaDominican RepublicEarly-demographic dividendEast Asia & PacificEast Asia & Pacific (excluding high income)East Asia & Pacific (IDA & IBRD countries)EcuadorEgypt, Arab Rep.El SalvadorEquatorial GuineaEritreaEstoniaEthiopiaEuro areaEurope & Central AsiaEurope & Central Asia (excluding high income)Europe & Central Asia (IDA & IBRD countries)European UnionFaroe IslandsFijiFinlandFragile and conflict affected situationsFranceFrench PolynesiaGabonGambia, TheGeorgiaGermanyGhanaGreeceGrenadaGuatemalaGuineaGuinea-BissauGuyanaHaitiHeavily indebted poor countries (HIPC)High incomeHondurasHong Kong SAR, ChinaHungaryIBRD onlyIcelandIDA & IBRD totalIDA onlyIDA totalIndiaIndonesiaIran, Islamic Rep.IraqIrelandIsraelItalyJamaicaJapanJordanKazakhstanKenyaKiribatiKorea, Rep.KosovoKuwaitKyrgyz RepublicLao PDRLate-demographic dividendLatin America & Caribbean Latin America & Caribbean (excluding high income)Latin America & the Caribbean (IDA & IBRD countries)LatviaLeast developed countries: UN classificationLebanonLesothoLiberiaLibyaLithuaniaLow & middle incomeLow incomeLower middle incomeLuxembourgMacao SAR, ChinaMacedonia, FYRMadagascarMalawiMalaysiaMaldivesMaliMaltaMarshall IslandsMauritaniaMauritiusMexicoMicronesia, Fed. Sts.Middle East & North AfricaMiddle East & North Africa (excluding high income)Middle East & North Africa (IDA & IBRD countries)Middle incomeMoldovaMongoliaMontenegroMoroccoMozambiqueMyanmarNamibiaNepalNetherlandsNew CaledoniaNew ZealandNicaraguaNigerNigeriaNorth AmericaNorwayOECD membersOmanOther small statesPacific island small statesPakistanPalauPanamaPapua New GuineaParaguayPeruPhilippinesPolandPortugalPost-demographic dividendPre-demographic dividendQatarRomaniaRussian FederationRwandaSamoaSao Tome and PrincipeSaudi ArabiaSenegalSerbiaSeychellesSierra LeoneSingaporeSint Maarten (Dutch part)Slovak RepublicSloveniaSmall statesSolomon IslandsSouth AfricaSouth AsiaSouth Asia (IDA & IBRD)South SudanSpainSri LankaSt. Kitts and NevisSt. LuciaSt. Vincent and the GrenadinesSub-Saharan Africa Sub-Saharan Africa (excluding high income)Sub-Saharan Africa (IDA & IBRD countries)SudanSurinameSwazilandSwedenSwitzerlandSyrian Arab RepublicTajikistanTanzaniaThailandTimor-LesteTogoTongaTrinidad and TobagoTunisiaTurkeyTuvaluUgandaUkraineUnited KingdomUnited StatesUpper middle incomeUruguayVanuatuVenezuela, RBWest Bank and GazaWorldYemen, Rep.ZambiaZimbabwe línea de tiempo (timeline):
En esta escala de tiempo se presenta un gráfico de 1976 y 2016 de Sri Lanka. Los datos de 1975 están ausentes. El número de observaciones reales por fecha: 41.
Fuente (nombre):
Indicadores del desarrollo mundial
Fuente (organización):
International Monetary Fund, Balance of Payments Statistics Yearbook and data files.
Categorías:
Private Sector, Trade
Se ha actualizado:
23 abr 2017 año
Los indicadores de los cambios de valor en los últimos años
Mínimo:
10.541
1 ene 2013 año
Máximo:
27.853
1 ene 1983 año
A la fecha de observación
Valor
Cambio absoluto
El cambio con respecto al valor anterior
1 ene 1976 año
19.699
+19.699
0.0%
1 ene 1977 año
19.185
-0.514
-2.61%
1 ene 1978 año
16.901
-2.284
-11.91%
1 ene 1979 año
14.66
-2.24
-13.25%
1 ene 1980 año
12.157
-2.504
-17.08%
1 ene 1981 año
21.917
+9.76
80.28%
1 ene 1982 año
26.406
+4.489
20.48%
1 ene 1983 año
27.853
+1.447
5.48%
1 ene 1984 año
25.997
-1.856
-6.66%
1 ene 1985 año
22.878
-3.119
-12.0%
1 ene 1986 año
22.572
-0.306
-1.34%
1 ene 1987 año
20.961
-1.611
-7.14%
1 ene 1988 año
21.946
+0.984
4.7%
1 ene 1989 año
19.717
-2.229
-10.16%
1 ene 1990 año
18.356
-1.36
-6.9%
1 ene 1991 año
17.066
-1.291
-7.03%
1 ene 1992 año
21.529
+4.463
26.15%
1 ene 1993 año
19.743
-1.787
-8.3%
1 ene 1994 año
21.602
+1.859
9.42%
1 ene 1995 año
20.301
-1.301
-6.02%
1 ene 1996 año
20.547
+0.245
1.21%
1 ene 1997 año
20.023
-0.524
-2.55%
1 ene 1998 año
19.819
-0.204
-1.02%
1 ene 1999 año
19.12
-0.699
-3.53%
1 ene 2000 año
19.635
+0.515
2.69%
1 ene 2001 año
17.431
-2.204
-11.22%
1 ene 2002 año
15.139
-2.293
-13.15%
1 ene 2003 año
20.684
+5.545
36.63%
1 ene 2004 año
18.828
-1.855
-8.97%
1 ene 2005 año
17.696
-1.133
-6.02%
1 ene 2006 año
16.889
-0.807
-4.56%
1 ene 2007 año
16.248
-0.641
-3.79%
1 ene 2008 año
15.917
-0.331
-2.04%
1 ene 2009 año
13.143
-2.775
-17.43%
1 ene 2010 año
15.224
+2.082
15.84%
1 ene 2011 año
13.342
-1.882
-12.36%
1 ene 2012 año
10.985
-2.357
-17.67%
1 ene 2013 año
10.541
-0.443
-4.03%
1 ene 2014 año
13.068
+2.526
23.97%
1 ene 2015 año
13.299
+0.231
1.77%
1 ene 2016 año
13.097
-0.201
-1.51%
Ranking de los países por los datos estadísticos actuales


Comentarios: