29
/es/
es
AIzaSyAYiBZKx7MnpbEhh9jyipgxe19OcubqV5w
April 1, 2024
219406
Papua New Guinea
PNG
true
2
1
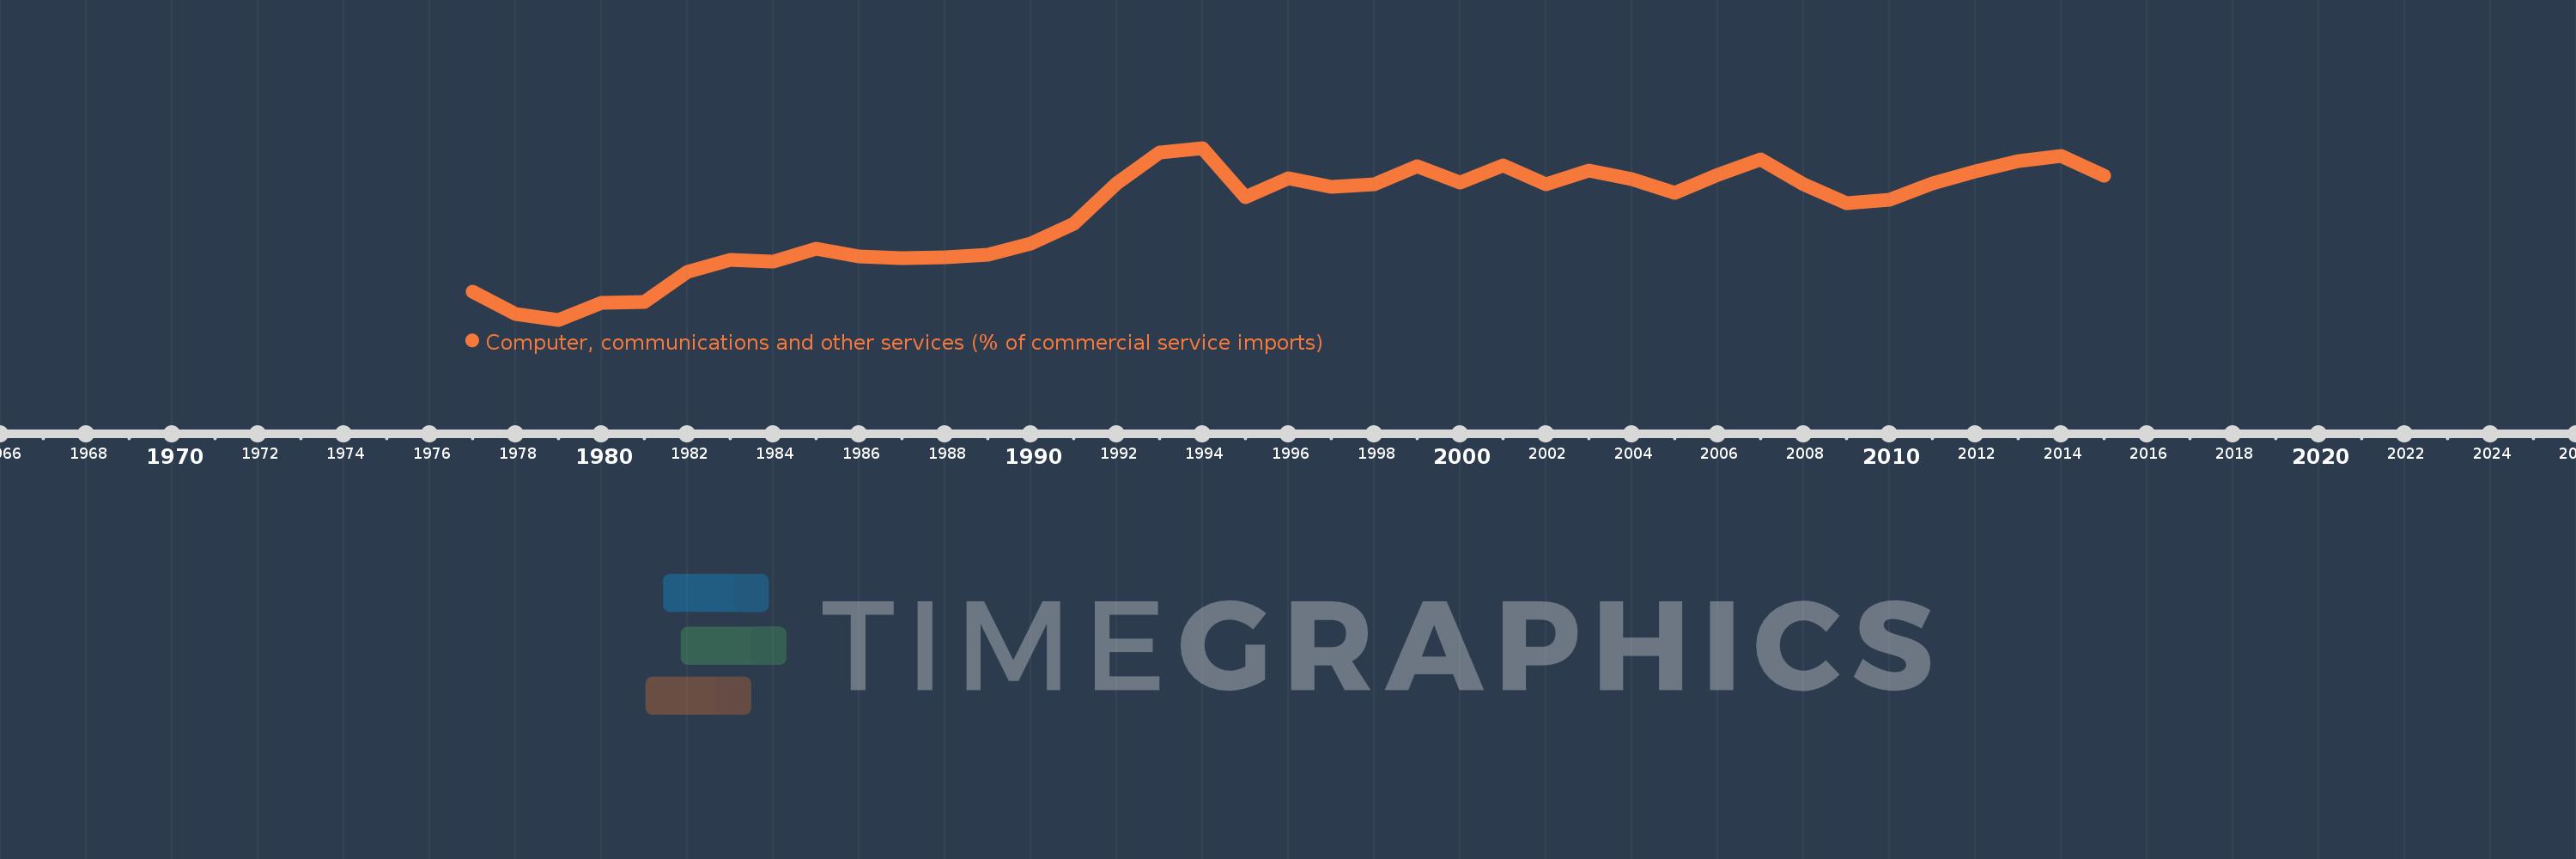
Computer, communications and other services (% of commercial service imports)
2015,2014,2013,2012,2011,2010,2009,2008,2007,2006,2005,2004,2003,2002,2001,2000,1999,1998,1997,1996,1995,1994,1993,1992,1991,1990,1989,1988,1987,1986,1985,1984,1983,1982,1981,1980,1979,1978,1977
Estas estadísticas en otros países:
AfghanistanAlbaniaAlgeriaAngolaAntigua and BarbudaArab WorldArgentinaArmeniaArubaAustraliaAustriaAzerbaijanBahamas, TheBahrainBangladeshBarbadosBelarusBelgiumBelizeBeninBermudaBhutanBoliviaBosnia and HerzegovinaBotswanaBrazilBrunei DarussalamBulgariaBurkina FasoBurundiCabo VerdeCambodiaCameroonCanadaCaribbean small statesCentral African RepublicCentral Europe and the BalticsChadChileChinaColombiaComorosCongo, Dem. Rep.Congo, Rep.Costa RicaCote d'IvoireCroatiaCuracaoCyprusCzech RepublicDenmarkDjiboutiDominicaDominican RepublicEarly-demographic dividendEast Asia & PacificEast Asia & Pacific (excluding high income)East Asia & Pacific (IDA & IBRD countries)EcuadorEgypt, Arab Rep.El SalvadorEquatorial GuineaEritreaEstoniaEthiopiaEuro areaEurope & Central AsiaEurope & Central Asia (excluding high income)Europe & Central Asia (IDA & IBRD countries)European UnionFaroe IslandsFijiFinlandFragile and conflict affected situationsFranceFrench PolynesiaGabonGambia, TheGeorgiaGermanyGhanaGreeceGrenadaGuatemalaGuineaGuinea-BissauGuyanaHaitiHeavily indebted poor countries (HIPC)High incomeHondurasHong Kong SAR, ChinaHungaryIBRD onlyIcelandIDA & IBRD totalIDA onlyIDA totalIndiaIndonesiaIran, Islamic Rep.IraqIrelandIsraelItalyJamaicaJapanJordanKazakhstanKenyaKiribatiKorea, Rep.KosovoKuwaitKyrgyz RepublicLao PDRLate-demographic dividendLatin America & Caribbean Latin America & Caribbean (excluding high income)Latin America & the Caribbean (IDA & IBRD countries)LatviaLeast developed countries: UN classificationLebanonLesothoLiberiaLibyaLithuaniaLow & middle incomeLow incomeLower middle incomeLuxembourgMacao SAR, ChinaMacedonia, FYRMadagascarMalawiMalaysiaMaldivesMaliMaltaMarshall IslandsMauritaniaMauritiusMexicoMicronesia, Fed. Sts.Middle East & North AfricaMiddle East & North Africa (excluding high income)Middle East & North Africa (IDA & IBRD countries)Middle incomeMoldovaMongoliaMontenegroMoroccoMozambiqueMyanmarNamibiaNepalNetherlandsNew CaledoniaNew ZealandNicaraguaNigerNigeriaNorth AmericaNorwayOECD membersOmanOther small statesPacific island small statesPakistanPalauPanamaPapua New GuineaParaguayPeruPhilippinesPolandPortugalPost-demographic dividendPre-demographic dividendQatarRomaniaRussian FederationRwandaSamoaSao Tome and PrincipeSaudi ArabiaSenegalSerbiaSeychellesSierra LeoneSingaporeSint Maarten (Dutch part)Slovak RepublicSloveniaSmall statesSolomon IslandsSouth AfricaSouth AsiaSouth Asia (IDA & IBRD)South SudanSpainSri LankaSt. Kitts and NevisSt. LuciaSt. Vincent and the GrenadinesSub-Saharan Africa Sub-Saharan Africa (excluding high income)Sub-Saharan Africa (IDA & IBRD countries)SudanSurinameSwazilandSwedenSwitzerlandSyrian Arab RepublicTajikistanTanzaniaThailandTimor-LesteTogoTongaTrinidad and TobagoTunisiaTurkeyTuvaluUgandaUkraineUnited KingdomUnited StatesUpper middle incomeUruguayVanuatuVenezuela, RBWest Bank and GazaWorldYemen, Rep.ZambiaZimbabwe línea de tiempo (timeline):
En esta escala de tiempo se presenta un gráfico de 1977 y 2015 de Papua New Guinea. Los datos de 1976 están ausentes. El número de observaciones reales por fecha: 39.
Fuente (nombre):
Indicadores del desarrollo mundial
Fuente (organización):
International Monetary Fund, Balance of Payments Statistics Yearbook and data files.
Categorías:
Private Sector, Trade
Se ha actualizado:
23 abr 2017 año
Los indicadores de los cambios de valor en los últimos años
Mínimo:
14.959
1 ene 1979 año
Máximo:
73.144
1 ene 1994 año
A la fecha de observación
Valor
Cambio absoluto
El cambio con respecto al valor anterior
1 ene 1977 año
24.332
+24.332
0.0%
1 ene 1978 año
16.793
-7.539
-30.98%
1 ene 1979 año
14.959
-1.834
-10.92%
1 ene 1980 año
20.547
+5.588
37.36%
1 ene 1981 año
20.86
+0.313
1.52%
1 ene 1982 año
31.125
+10.265
49.21%
1 ene 1983 año
35.336
+4.211
13.53%
1 ene 1984 año
34.722
-0.614
-1.74%
1 ene 1985 año
38.938
+4.216
12.14%
1 ene 1986 año
36.328
-2.61
-6.7%
1 ene 1987 año
35.801
-0.527
-1.45%
1 ene 1988 año
36.196
+0.394
1.1%
1 ene 1989 año
37.036
+0.841
2.32%
1 ene 1990 año
40.722
+3.686
9.95%
1 ene 1991 año
47.576
+6.854
16.83%
1 ene 1992 año
61.165
+13.589
28.56%
1 ene 1993 año
71.509
+10.345
16.91%
1 ene 1994 año
73.144
+1.635
2.29%
1 ene 1995 año
56.544
-16.6
-22.69%
1 ene 1996 año
62.957
+6.413
11.34%
1 ene 1997 año
60.051
-2.905
-4.61%
1 ene 1998 año
60.744
+0.692
1.15%
1 ene 1999 año
67.05
+6.306
10.38%
1 ene 2000 año
61.444
-5.606
-8.36%
1 ene 2001 año
67.186
+5.742
9.35%
1 ene 2002 año
60.808
-6.378
-9.49%
1 ene 2003 año
65.577
+4.768
7.84%
1 ene 2004 año
62.588
-2.989
-4.56%
1 ene 2005 año
57.946
-4.641
-7.42%
1 ene 2006 año
64.156
+6.209
10.72%
1 ene 2007 año
69.15
+4.994
7.78%
1 ene 2008 año
60.794
-8.356
-12.08%
1 ene 2009 año
54.334
-6.46
-10.63%
1 ene 2010 año
55.72
+1.386
2.55%
1 ene 2011 año
61.238
+5.518
9.9%
1 ene 2012 año
65.109
+3.871
6.32%
1 ene 2013 año
68.752
+3.643
5.59%
1 ene 2014 año
70.295
+1.543
2.24%
1 ene 2015 año
63.639
-6.656
-9.47%
Ranking de los países por los datos estadísticos actuales


Comentarios: