29
/es/
es
AIzaSyAYiBZKx7MnpbEhh9jyipgxe19OcubqV5w
April 1, 2024
79851
Barbados
BRB
true
2
1
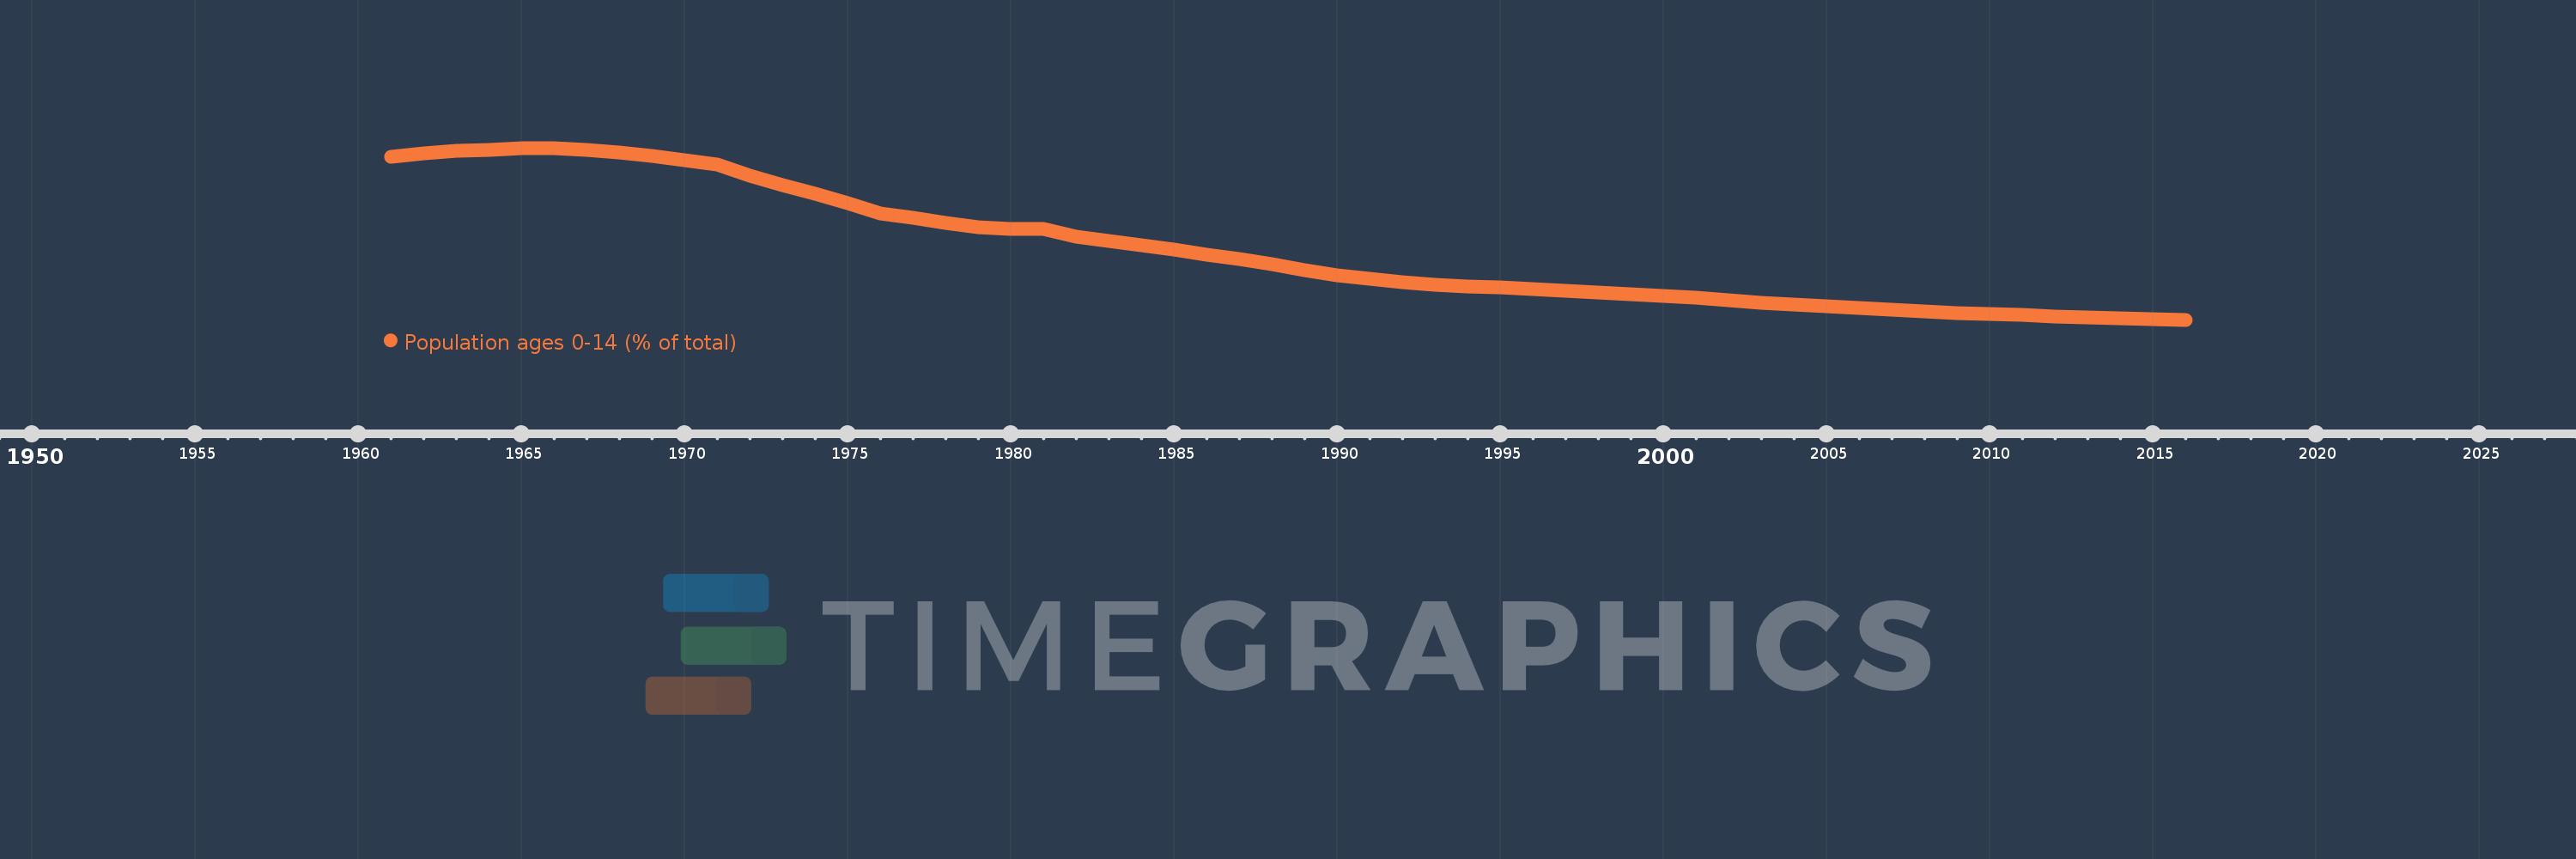
Population ages 0-14 (% of total)
2016,2015,2014,2013,2012,2011,2010,2009,2008,2007,2006,2005,2004,2003,2002,2001,2000,1999,1998,1997,1996,1995,1994,1993,1992,1991,1990,1989,1988,1987,1986,1985,1984,1983,1982,1981,1980,1979,1978,1977,1976,1975,1974,1973,1972,1971,1970,1969,1968,1967,1966,1965,1964,1963,1962,1961
Estas estadísticas en otros países:
AfghanistanAlbaniaAlgeriaAngolaAntigua and BarbudaArab WorldArgentinaArmeniaArubaAustraliaAustriaAzerbaijanBahamas, TheBahrainBangladeshBarbadosBelarusBelgiumBelizeBeninBhutanBoliviaBosnia and HerzegovinaBotswanaBrazilBrunei DarussalamBulgariaBurkina FasoBurundiCabo VerdeCambodiaCameroonCanadaCaribbean small statesCentral African RepublicCentral Europe and the BalticsChadChannel IslandsChileChinaColombiaComorosCongo, Dem. Rep.Congo, Rep.Costa RicaCote d'IvoireCroatiaCubaCuracaoCyprusCzech RepublicDenmarkDjiboutiDominican RepublicEarly-demographic dividendEast Asia & PacificEast Asia & Pacific (excluding high income)East Asia & Pacific (IDA & IBRD countries)EcuadorEgypt, Arab Rep.El SalvadorEquatorial GuineaEritreaEstoniaEthiopiaEuro areaEurope & Central AsiaEurope & Central Asia (excluding high income)Europe & Central Asia (IDA & IBRD countries)European UnionFijiFinlandFragile and conflict affected situationsFranceFrench PolynesiaGabonGambia, TheGeorgiaGermanyGhanaGreeceGrenadaGuamGuatemalaGuineaGuinea-BissauGuyanaHaitiHeavily indebted poor countries (HIPC)High incomeHondurasHong Kong SAR, ChinaHungaryIBRD onlyIcelandIDA & IBRD totalIDA blendIDA onlyIDA totalIndiaIndonesiaIran, Islamic Rep.IraqIrelandIsraelItalyJamaicaJapanJordanKazakhstanKenyaKiribatiKorea, Dem. People’s Rep.Korea, Rep.KosovoKuwaitKyrgyz RepublicLao PDRLate-demographic dividendLatin America & Caribbean Latin America & Caribbean (excluding high income)Latin America & the Caribbean (IDA & IBRD countries)LatviaLeast developed countries: UN classificationLebanonLesothoLiberiaLibyaLithuaniaLow & middle incomeLow incomeLower middle incomeLuxembourgMacao SAR, ChinaMacedonia, FYRMadagascarMalawiMalaysiaMaldivesMaliMaltaMauritaniaMauritiusMexicoMicronesia, Fed. Sts.Middle East & North AfricaMiddle East & North Africa (excluding high income)Middle East & North Africa (IDA & IBRD countries)Middle incomeMoldovaMongoliaMontenegroMoroccoMozambiqueMyanmarNamibiaNepalNetherlandsNew CaledoniaNew ZealandNicaraguaNigerNigeriaNorth AmericaNorwayOECD membersOmanOther small statesPacific island small statesPakistanPanamaPapua New GuineaParaguayPeruPhilippinesPolandPortugalPost-demographic dividendPre-demographic dividendPuerto RicoQatarRomaniaRussian FederationRwandaSamoaSao Tome and PrincipeSaudi ArabiaSenegalSerbiaSeychellesSierra LeoneSingaporeSlovak RepublicSloveniaSmall statesSolomon IslandsSomaliaSouth AfricaSouth AsiaSouth Asia (IDA & IBRD)South SudanSpainSri LankaSt. LuciaSt. Vincent and the GrenadinesSub-Saharan Africa Sub-Saharan Africa (excluding high income)Sub-Saharan Africa (IDA & IBRD countries)SudanSurinameSwazilandSwedenSwitzerlandSyrian Arab RepublicTajikistanTanzaniaThailandTimor-LesteTogoTongaTrinidad and TobagoTunisiaTurkeyTurkmenistanUgandaUkraineUnited Arab EmiratesUnited KingdomUnited StatesUpper middle incomeUruguayUzbekistanVanuatuVenezuela, RBVietnamVirgin Islands (U.S.)West Bank and GazaWorldYemen, Rep.ZambiaZimbabwe línea de tiempo (timeline):
En esta escala de tiempo se presenta un gráfico de 1961 y 2016 de Barbados. Los datos de 1960 están ausentes. El número de observaciones reales por fecha: 56.
Fuente (nombre):
Indicadores del desarrollo mundial
Fuente (organización):
World Bank staff estimates based on age distributions of United Nations Population Division's World Population Prospects.
Categorías:
Education, Health
Se ha actualizado:
23 abr 2017 año
Los indicadores de los cambios de valor en los últimos años
Mínimo:
19.366
1 ene 2016 año
Máximo:
39.053
1 ene 1966 año
A la fecha de observación
Valor
Cambio absoluto
El cambio con respecto al valor anterior
1 ene 1961 año
38.081
+38.081
0.0%
1 ene 1962 año
38.437
+0.356
0.94%
1 ene 1963 año
38.694
+0.257
0.67%
1 ene 1964 año
38.868
+0.174
0.45%
1 ene 1965 año
38.987
+0.119
0.31%
1 ene 1966 año
39.053
+0.065
0.17%
1 ene 1967 año
38.87
-0.183
-0.47%
1 ene 1968 año
38.552
-0.318
-0.82%
1 ene 1969 año
38.128
-0.424
-1.1%
1 ene 1970 año
37.646
-0.482
-1.26%
1 ene 1971 año
37.12
-0.526
-1.4%
1 ene 1972 año
35.91
-1.211
-3.26%
1 ene 1973 año
34.837
-1.072
-2.99%
1 ene 1974 año
33.805
-1.032
-2.96%
1 ene 1975 año
32.699
-1.106
-3.27%
1 ene 1976 año
31.52
-1.179
-3.61%
1 ene 1977 año
31.06
-0.46
-1.46%
1 ene 1978 año
30.476
-0.585
-1.88%
1 ene 1979 año
29.977
-0.499
-1.64%
1 ene 1980 año
29.751
-0.226
-0.75%
1 ene 1981 año
29.774
+0.023
0.08%
1 ene 1982 año
28.924
-0.85
-2.85%
1 ene 1983 año
28.353
-0.572
-1.98%
1 ene 1984 año
27.912
-0.44
-1.55%
1 ene 1985 año
27.417
-0.495
-1.77%
1 ene 1986 año
26.81
-0.607
-2.21%
1 ene 1987 año
26.347
-0.463
-1.73%
1 ene 1988 año
25.736
-0.611
-2.32%
1 ene 1989 año
25.07
-0.666
-2.59%
1 ene 1990 año
24.496
-0.574
-2.29%
1 ene 1991 año
24.077
-0.419
-1.71%
1 ene 1992 año
23.645
-0.432
-1.79%
1 ene 1993 año
23.372
-0.273
-1.16%
1 ene 1994 año
23.201
-0.171
-0.73%
1 ene 1995 año
23.042
-0.159
-0.69%
1 ene 1996 año
22.853
-0.188
-0.82%
1 ene 1997 año
22.679
-0.174
-0.76%
1 ene 1998 año
22.474
-0.205
-0.9%
1 ene 1999 año
22.261
-0.213
-0.95%
1 ene 2000 año
22.08
-0.181
-0.81%
1 ene 2001 año
21.942
-0.138
-0.63%
1 ene 2002 año
21.592
-0.35
-1.59%
1 ene 2003 año
21.331
-0.261
-1.21%
1 ene 2004 año
21.126
-0.205
-0.96%
1 ene 2005 año
20.931
-0.195
-0.92%
1 ene 2006 año
20.726
-0.204
-0.98%
1 ene 2007 año
20.548
-0.178
-0.86%
1 ene 2008 año
20.353
-0.195
-0.95%
1 ene 2009 año
20.163
-0.191
-0.94%
1 ene 2010 año
20.016
-0.147
-0.73%
1 ene 2011 año
19.921
-0.095
-0.48%
1 ene 2012 año
19.717
-0.203
-1.02%
1 ene 2013 año
19.587
-0.13
-0.66%
1 ene 2014 año
19.506
-0.081
-0.42%
1 ene 2015 año
19.438
-0.067
-0.35%
1 ene 2016 año
19.366
-0.072
-0.37%
Ranking de los países por los datos estadísticos actuales


Comentarios: