29
/es/
es
AIzaSyAYiBZKx7MnpbEhh9jyipgxe19OcubqV5w
April 1, 2024
178096
Lesotho
LSO
true
2
1
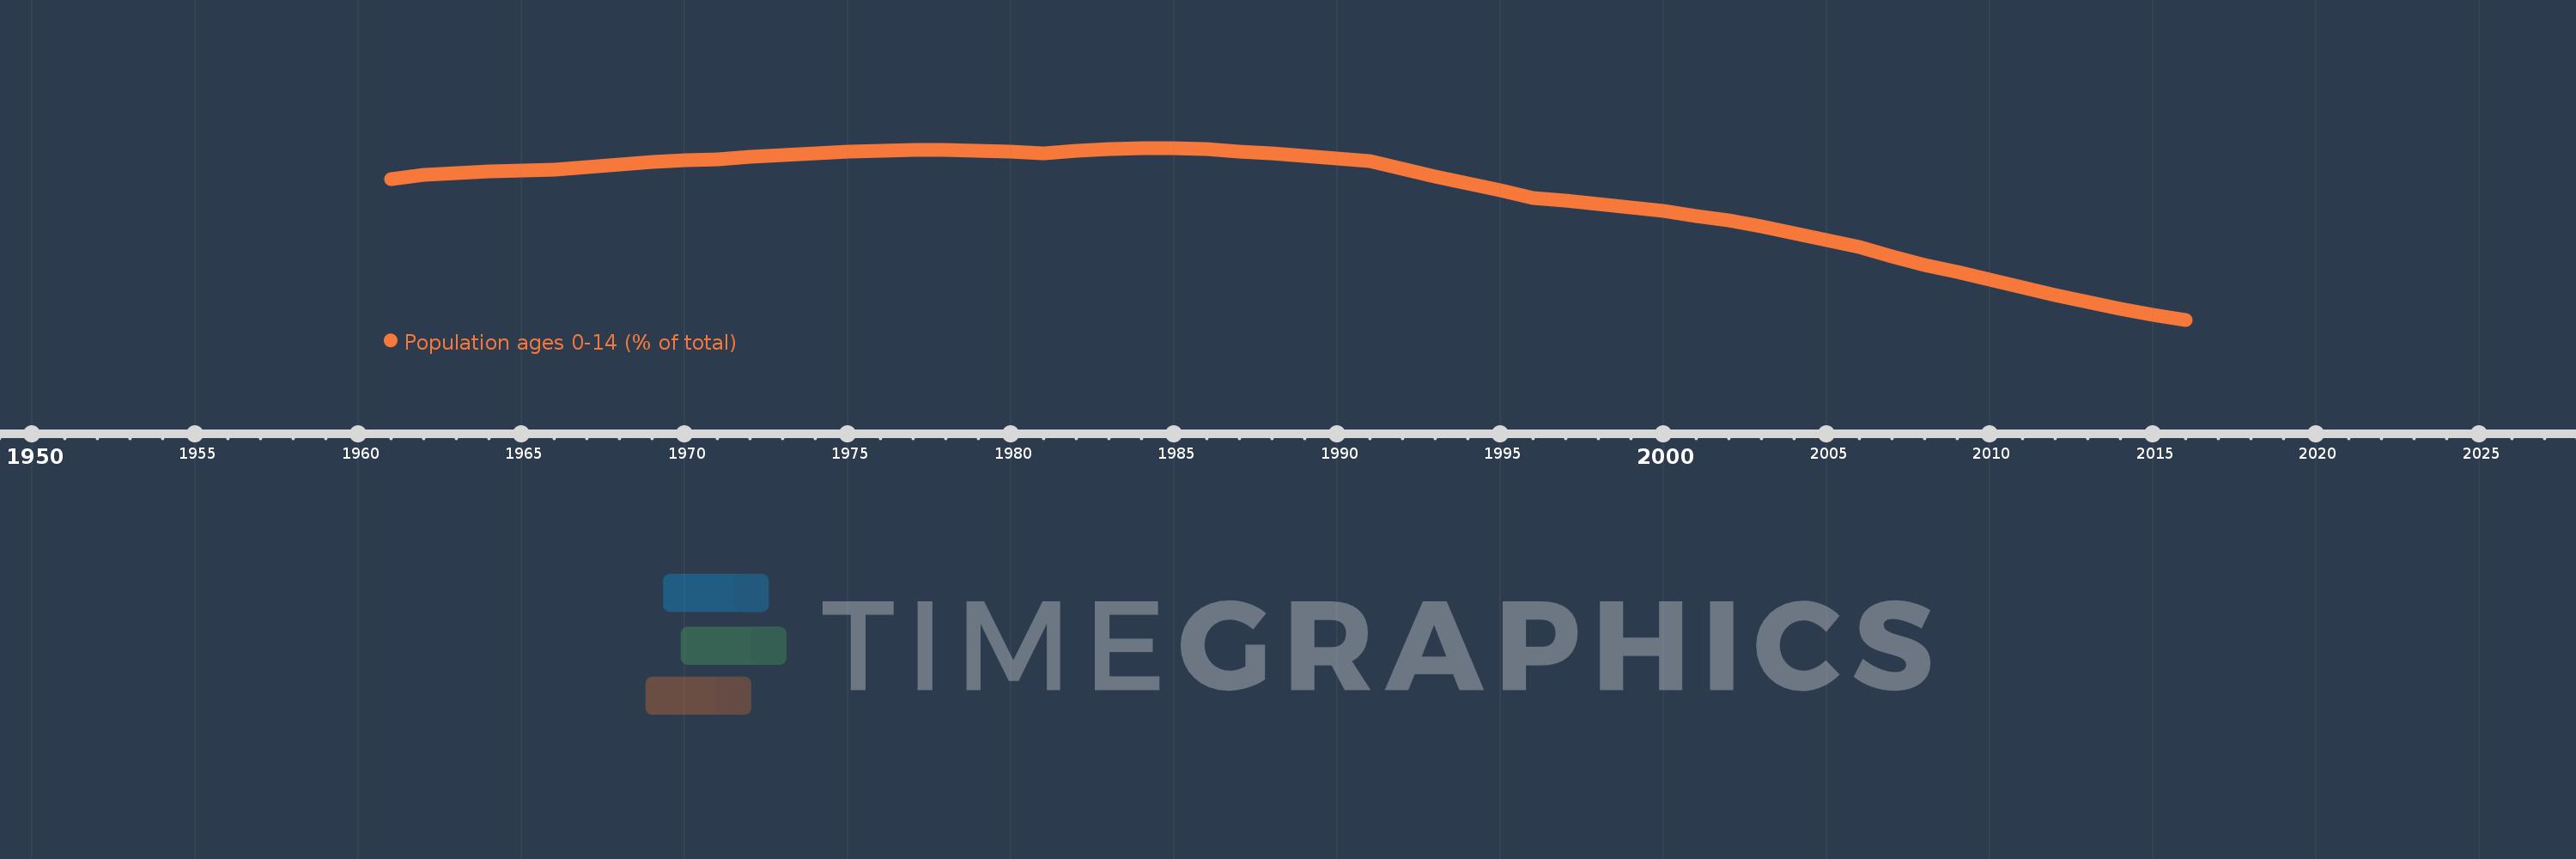
Population ages 0-14 (% of total)
2016,2015,2014,2013,2012,2011,2010,2009,2008,2007,2006,2005,2004,2003,2002,2001,2000,1999,1998,1997,1996,1995,1994,1993,1992,1991,1990,1989,1988,1987,1986,1985,1984,1983,1982,1981,1980,1979,1978,1977,1976,1975,1974,1973,1972,1971,1970,1969,1968,1967,1966,1965,1964,1963,1962,1961
Estas estadísticas en otros países:
AfghanistanAlbaniaAlgeriaAngolaAntigua and BarbudaArab WorldArgentinaArmeniaArubaAustraliaAustriaAzerbaijanBahamas, TheBahrainBangladeshBarbadosBelarusBelgiumBelizeBeninBhutanBoliviaBosnia and HerzegovinaBotswanaBrazilBrunei DarussalamBulgariaBurkina FasoBurundiCabo VerdeCambodiaCameroonCanadaCaribbean small statesCentral African RepublicCentral Europe and the BalticsChadChannel IslandsChileChinaColombiaComorosCongo, Dem. Rep.Congo, Rep.Costa RicaCote d'IvoireCroatiaCubaCuracaoCyprusCzech RepublicDenmarkDjiboutiDominican RepublicEarly-demographic dividendEast Asia & PacificEast Asia & Pacific (excluding high income)East Asia & Pacific (IDA & IBRD countries)EcuadorEgypt, Arab Rep.El SalvadorEquatorial GuineaEritreaEstoniaEthiopiaEuro areaEurope & Central AsiaEurope & Central Asia (excluding high income)Europe & Central Asia (IDA & IBRD countries)European UnionFijiFinlandFragile and conflict affected situationsFranceFrench PolynesiaGabonGambia, TheGeorgiaGermanyGhanaGreeceGrenadaGuamGuatemalaGuineaGuinea-BissauGuyanaHaitiHeavily indebted poor countries (HIPC)High incomeHondurasHong Kong SAR, ChinaHungaryIBRD onlyIcelandIDA & IBRD totalIDA blendIDA onlyIDA totalIndiaIndonesiaIran, Islamic Rep.IraqIrelandIsraelItalyJamaicaJapanJordanKazakhstanKenyaKiribatiKorea, Dem. People’s Rep.Korea, Rep.KosovoKuwaitKyrgyz RepublicLao PDRLate-demographic dividendLatin America & Caribbean Latin America & Caribbean (excluding high income)Latin America & the Caribbean (IDA & IBRD countries)LatviaLeast developed countries: UN classificationLebanonLesothoLiberiaLibyaLithuaniaLow & middle incomeLow incomeLower middle incomeLuxembourgMacao SAR, ChinaMacedonia, FYRMadagascarMalawiMalaysiaMaldivesMaliMaltaMauritaniaMauritiusMexicoMicronesia, Fed. Sts.Middle East & North AfricaMiddle East & North Africa (excluding high income)Middle East & North Africa (IDA & IBRD countries)Middle incomeMoldovaMongoliaMontenegroMoroccoMozambiqueMyanmarNamibiaNepalNetherlandsNew CaledoniaNew ZealandNicaraguaNigerNigeriaNorth AmericaNorwayOECD membersOmanOther small statesPacific island small statesPakistanPanamaPapua New GuineaParaguayPeruPhilippinesPolandPortugalPost-demographic dividendPre-demographic dividendPuerto RicoQatarRomaniaRussian FederationRwandaSamoaSao Tome and PrincipeSaudi ArabiaSenegalSerbiaSeychellesSierra LeoneSingaporeSlovak RepublicSloveniaSmall statesSolomon IslandsSomaliaSouth AfricaSouth AsiaSouth Asia (IDA & IBRD)South SudanSpainSri LankaSt. LuciaSt. Vincent and the GrenadinesSub-Saharan Africa Sub-Saharan Africa (excluding high income)Sub-Saharan Africa (IDA & IBRD countries)SudanSurinameSwazilandSwedenSwitzerlandSyrian Arab RepublicTajikistanTanzaniaThailandTimor-LesteTogoTongaTrinidad and TobagoTunisiaTurkeyTurkmenistanUgandaUkraineUnited Arab EmiratesUnited KingdomUnited StatesUpper middle incomeUruguayUzbekistanVanuatuVenezuela, RBVietnamVirgin Islands (U.S.)West Bank and GazaWorldYemen, Rep.ZambiaZimbabwe línea de tiempo (timeline):
En esta escala de tiempo se presenta un gráfico de 1961 y 2016 de Lesotho. Los datos de 1960 están ausentes. El número de observaciones reales por fecha: 56.
Fuente (nombre):
Indicadores del desarrollo mundial
Fuente (organización):
World Bank staff estimates based on age distributions of United Nations Population Division's World Population Prospects.
Categorías:
Education, Health
Se ha actualizado:
23 abr 2017 año
Los indicadores de los cambios de valor en los últimos años
Mínimo:
36.073
1 ene 2016 año
Máximo:
44.614
1 ene 1984 año
A la fecha de observación
Valor
Cambio absoluto
El cambio con respecto al valor anterior
1 ene 1961 año
43.056
+43.056
0.0%
1 ene 1962 año
43.26
+0.204
0.47%
1 ene 1963 año
43.377
+0.117
0.27%
1 ene 1964 año
43.434
+0.057
0.13%
1 ene 1965 año
43.482
+0.048
0.11%
1 ene 1966 año
43.547
+0.065
0.15%
1 ene 1967 año
43.669
+0.122
0.28%
1 ene 1968 año
43.79
+0.121
0.28%
1 ene 1969 año
43.9
+0.11
0.25%
1 ene 1970 año
43.984
+0.084
0.19%
1 ene 1971 año
44.035
+0.052
0.12%
1 ene 1972 año
44.167
+0.131
0.3%
1 ene 1973 año
44.272
+0.105
0.24%
1 ene 1974 año
44.353
+0.081
0.18%
1 ene 1975 año
44.418
+0.065
0.15%
1 ene 1976 año
44.471
+0.053
0.12%
1 ene 1977 año
44.507
+0.037
0.08%
1 ene 1978 año
44.507
0.0
0.0%
1 ene 1979 año
44.477
-0.031
-0.07%
1 ene 1980 año
44.419
-0.057
-0.13%
1 ene 1981 año
44.335
-0.084
-0.19%
1 ene 1982 año
44.469
+0.134
0.3%
1 ene 1983 año
44.564
+0.095
0.21%
1 ene 1984 año
44.614
+0.05
0.11%
1 ene 1985 año
44.608
-0.006
-0.01%
1 ene 1986 año
44.538
-0.07
-0.16%
1 ene 1987 año
44.451
-0.087
-0.19%
1 ene 1988 año
44.33
-0.121
-0.27%
1 ene 1989 año
44.198
-0.132
-0.3%
1 ene 1990 año
44.069
-0.129
-0.29%
1 ene 1991 año
43.94
-0.129
-0.29%
1 ene 1992 año
43.555
-0.385
-0.88%
1 ene 1993 año
43.196
-0.359
-0.82%
1 ene 1994 año
42.854
-0.342
-0.79%
1 ene 1995 año
42.505
-0.349
-0.81%
1 ene 1996 año
42.134
-0.372
-0.87%
1 ene 1997 año
41.995
-0.139
-0.33%
1 ene 1998 año
41.841
-0.154
-0.37%
1 ene 1999 año
41.669
-0.173
-0.41%
1 ene 2000 año
41.468
-0.201
-0.48%
1 ene 2001 año
41.226
-0.242
-0.58%
1 ene 2002 año
41.017
-0.209
-0.51%
1 ene 2003 año
40.716
-0.301
-0.73%
1 ene 2004 año
40.364
-0.353
-0.87%
1 ene 2005 año
40.011
-0.353
-0.87%
1 ene 2006 año
39.684
-0.328
-0.82%
1 ene 2007 año
39.208
-0.476
-1.2%
1 ene 2008 año
38.801
-0.407
-1.04%
1 ene 2009 año
38.437
-0.364
-0.94%
1 ene 2010 año
38.071
-0.366
-0.95%
1 ene 2011 año
37.692
-0.38
-1.0%
1 ene 2012 año
37.319
-0.372
-0.99%
1 ene 2013 año
36.955
-0.364
-0.98%
1 ene 2014 año
36.614
-0.341
-0.92%
1 ene 2015 año
36.318
-0.296
-0.81%
1 ene 2016 año
36.073
-0.246
-0.68%
Ranking de los países por los datos estadísticos actuales


Comentarios: