29
/es/
es
AIzaSyAYiBZKx7MnpbEhh9jyipgxe19OcubqV5w
April 1, 2024
26818
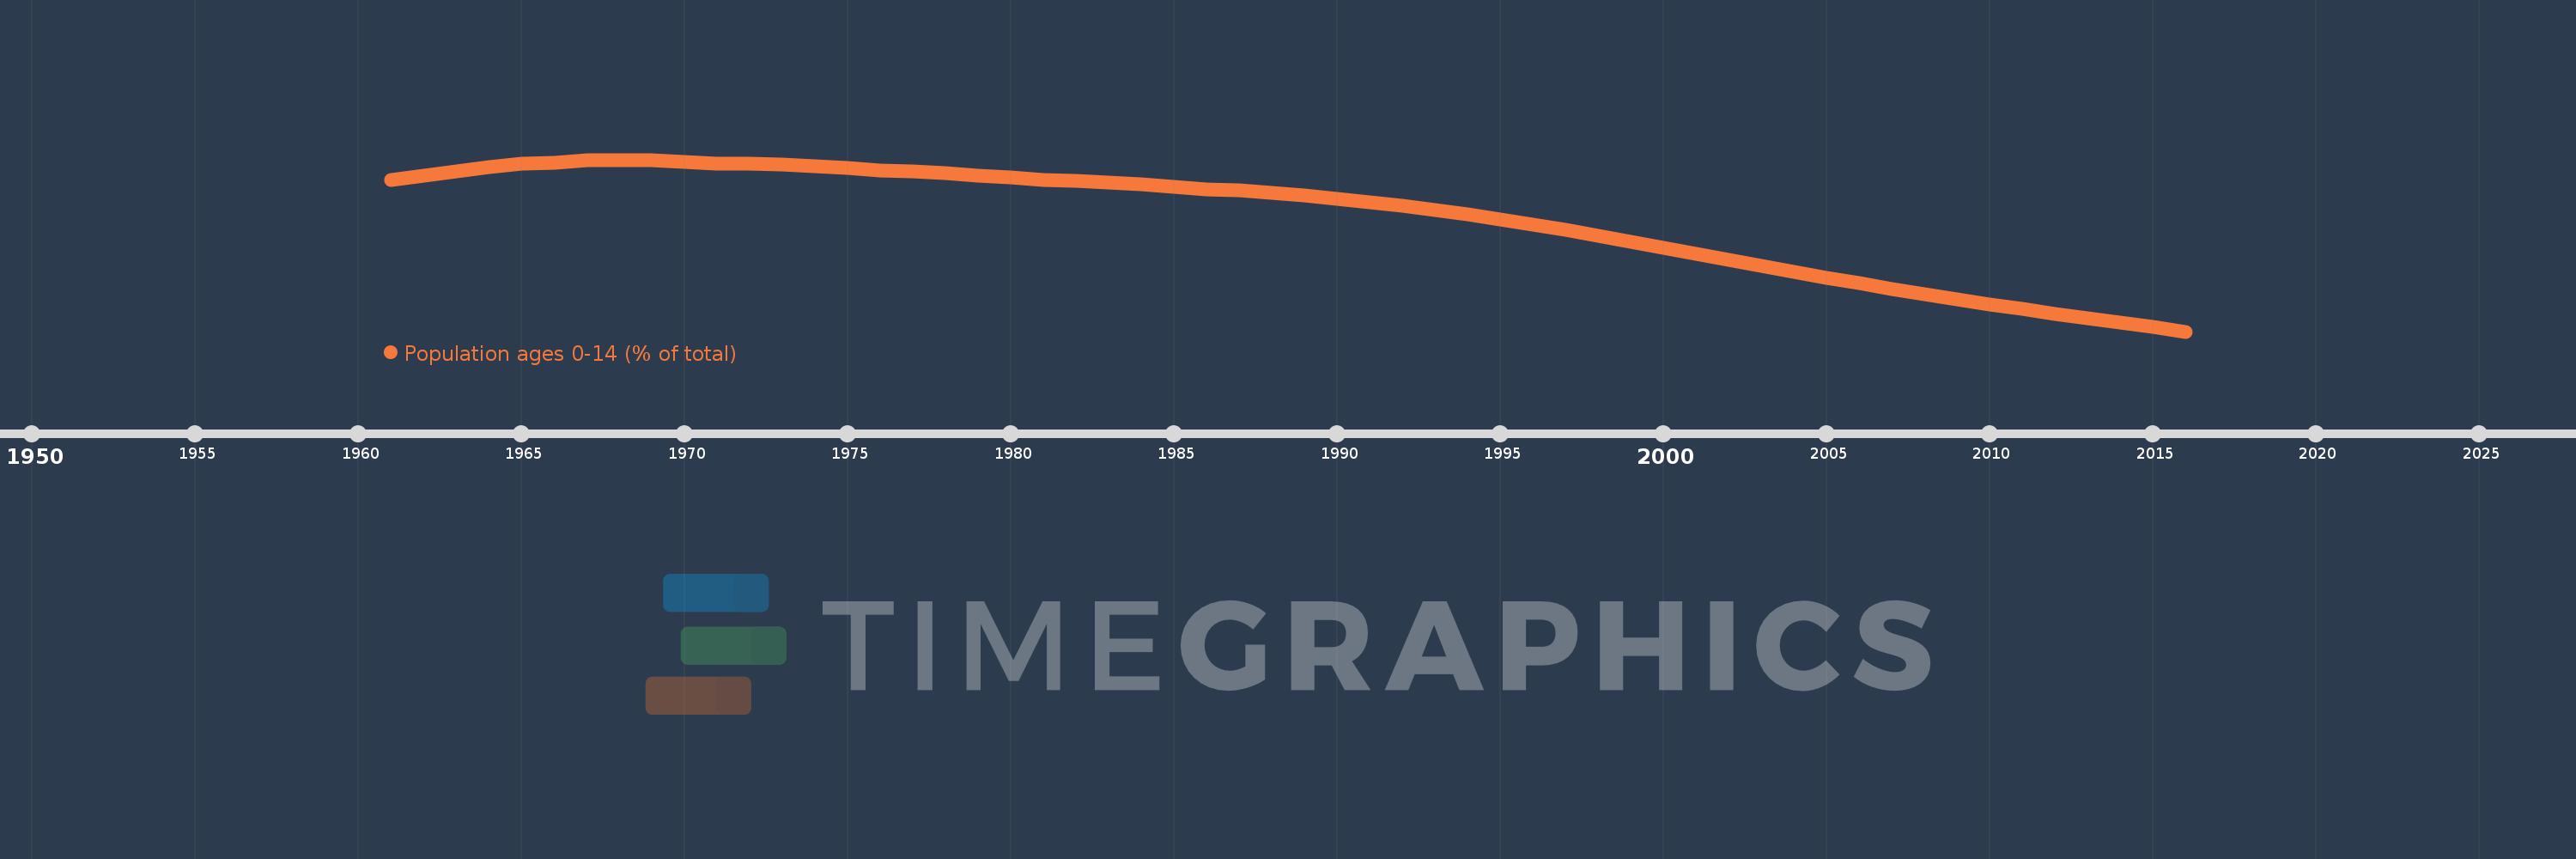
Early-demographic dividend
EAR
false
2
1
Population ages 0-14 (% of total)
2016,2015,2014,2013,2012,2011,2010,2009,2008,2007,2006,2005,2004,2003,2002,2001,2000,1999,1998,1997,1996,1995,1994,1993,1992,1991,1990,1989,1988,1987,1986,1985,1984,1983,1982,1981,1980,1979,1978,1977,1976,1975,1974,1973,1972,1971,1970,1969,1968,1967,1966,1965,1964,1963,1962,1961
Estas estadísticas en otros países:
AfghanistanAlbaniaAlgeriaAngolaAntigua and BarbudaArab WorldArgentinaArmeniaArubaAustraliaAustriaAzerbaijanBahamas, TheBahrainBangladeshBarbadosBelarusBelgiumBelizeBeninBhutanBoliviaBosnia and HerzegovinaBotswanaBrazilBrunei DarussalamBulgariaBurkina FasoBurundiCabo VerdeCambodiaCameroonCanadaCaribbean small statesCentral African RepublicCentral Europe and the BalticsChadChannel IslandsChileChinaColombiaComorosCongo, Dem. Rep.Congo, Rep.Costa RicaCote d'IvoireCroatiaCubaCuracaoCyprusCzech RepublicDenmarkDjiboutiDominican RepublicEarly-demographic dividendEast Asia & PacificEast Asia & Pacific (excluding high income)East Asia & Pacific (IDA & IBRD countries)EcuadorEgypt, Arab Rep.El SalvadorEquatorial GuineaEritreaEstoniaEthiopiaEuro areaEurope & Central AsiaEurope & Central Asia (excluding high income)Europe & Central Asia (IDA & IBRD countries)European UnionFijiFinlandFragile and conflict affected situationsFranceFrench PolynesiaGabonGambia, TheGeorgiaGermanyGhanaGreeceGrenadaGuamGuatemalaGuineaGuinea-BissauGuyanaHaitiHeavily indebted poor countries (HIPC)High incomeHondurasHong Kong SAR, ChinaHungaryIBRD onlyIcelandIDA & IBRD totalIDA blendIDA onlyIDA totalIndiaIndonesiaIran, Islamic Rep.IraqIrelandIsraelItalyJamaicaJapanJordanKazakhstanKenyaKiribatiKorea, Dem. People’s Rep.Korea, Rep.KosovoKuwaitKyrgyz RepublicLao PDRLate-demographic dividendLatin America & Caribbean Latin America & Caribbean (excluding high income)Latin America & the Caribbean (IDA & IBRD countries)LatviaLeast developed countries: UN classificationLebanonLesothoLiberiaLibyaLithuaniaLow & middle incomeLow incomeLower middle incomeLuxembourgMacao SAR, ChinaMacedonia, FYRMadagascarMalawiMalaysiaMaldivesMaliMaltaMauritaniaMauritiusMexicoMicronesia, Fed. Sts.Middle East & North AfricaMiddle East & North Africa (excluding high income)Middle East & North Africa (IDA & IBRD countries)Middle incomeMoldovaMongoliaMontenegroMoroccoMozambiqueMyanmarNamibiaNepalNetherlandsNew CaledoniaNew ZealandNicaraguaNigerNigeriaNorth AmericaNorwayOECD membersOmanOther small statesPacific island small statesPakistanPanamaPapua New GuineaParaguayPeruPhilippinesPolandPortugalPost-demographic dividendPre-demographic dividendPuerto RicoQatarRomaniaRussian FederationRwandaSamoaSao Tome and PrincipeSaudi ArabiaSenegalSerbiaSeychellesSierra LeoneSingaporeSlovak RepublicSloveniaSmall statesSolomon IslandsSomaliaSouth AfricaSouth AsiaSouth Asia (IDA & IBRD)South SudanSpainSri LankaSt. LuciaSt. Vincent and the GrenadinesSub-Saharan Africa Sub-Saharan Africa (excluding high income)Sub-Saharan Africa (IDA & IBRD countries)SudanSurinameSwazilandSwedenSwitzerlandSyrian Arab RepublicTajikistanTanzaniaThailandTimor-LesteTogoTongaTrinidad and TobagoTunisiaTurkeyTurkmenistanUgandaUkraineUnited Arab EmiratesUnited KingdomUnited StatesUpper middle incomeUruguayUzbekistanVanuatuVenezuela, RBVietnamVirgin Islands (U.S.)West Bank and GazaWorldYemen, Rep.ZambiaZimbabwe línea de tiempo (timeline):
En esta escala de tiempo se presenta un gráfico de 1961 y 2016 de Early-demographic dividend. Los datos de 1960 están ausentes. El número de observaciones reales por fecha: 56.
Fuente (nombre):
Indicadores del desarrollo mundial
Fuente (organización):
World Bank staff estimates based on age distributions of United Nations Population Division's World Population Prospects.
Categorías:
Education, Health
Se ha actualizado:
23 abr 2017 año
Los indicadores de los cambios de valor en los últimos años
Mínimo:
29.978
1 ene 2016 año
Máximo:
42.571
1 ene 1968 año
A la fecha de observación
Valor
Cambio absoluto
El cambio con respecto al valor anterior
1 ene 1961 año
41.097
+41.097
0.0%
1 ene 1962 año
41.421
+0.324
0.79%
1 ene 1963 año
41.749
+0.328
0.79%
1 ene 1964 año
42.048
+0.299
0.72%
1 ene 1965 año
42.263
+0.215
0.51%
1 ene 1966 año
42.372
+0.109
0.26%
1 ene 1967 año
42.531
+0.159
0.38%
1 ene 1968 año
42.571
+0.04
0.09%
1 ene 1969 año
42.522
-0.049
-0.12%
1 ene 1970 año
42.427
-0.095
-0.22%
1 ene 1971 año
42.311
-0.116
-0.27%
1 ene 1972 año
42.274
-0.037
-0.09%
1 ene 1973 año
42.201
-0.073
-0.17%
1 ene 1974 año
42.096
-0.105
-0.25%
1 ene 1975 año
41.959
-0.137
-0.33%
1 ene 1976 año
41.791
-0.168
-0.4%
1 ene 1977 año
41.716
-0.075
-0.18%
1 ene 1978 año
41.59
-0.125
-0.3%
1 ene 1979 año
41.433
-0.158
-0.38%
1 ene 1980 año
41.263
-0.169
-0.41%
1 ene 1981 año
41.095
-0.168
-0.41%
1 ene 1982 año
41.001
-0.094
-0.23%
1 ene 1983 año
40.894
-0.108
-0.26%
1 ene 1984 año
40.769
-0.125
-0.31%
1 ene 1985 año
40.616
-0.153
-0.38%
1 ene 1986 año
40.428
-0.188
-0.46%
1 ene 1987 año
40.322
-0.105
-0.26%
1 ene 1988 año
40.158
-0.164
-0.41%
1 ene 1989 año
39.948
-0.21
-0.52%
1 ene 1990 año
39.704
-0.244
-0.61%
1 ene 1991 año
39.436
-0.267
-0.67%
1 ene 1992 año
39.189
-0.247
-0.63%
1 ene 1993 año
38.904
-0.285
-0.73%
1 ene 1994 año
38.581
-0.323
-0.83%
1 ene 1995 año
38.219
-0.362
-0.94%
1 ene 1996 año
37.821
-0.397
-1.04%
1 ene 1997 año
37.432
-0.389
-1.03%
1 ene 1998 año
37.019
-0.413
-1.1%
1 ene 1999 año
36.584
-0.435
-1.17%
1 ene 2000 año
36.129
-0.455
-1.25%
1 ene 2001 año
35.656
-0.473
-1.31%
1 ene 2002 año
35.25
-0.406
-1.14%
1 ene 2003 año
34.82
-0.43
-1.22%
1 ene 2004 año
34.378
-0.442
-1.27%
1 ene 2005 año
33.94
-0.438
-1.28%
1 ene 2006 año
33.515
-0.425
-1.25%
1 ene 2007 año
33.109
-0.406
-1.21%
1 ene 2008 año
32.723
-0.386
-1.17%
1 ene 2009 año
32.353
-0.37
-1.13%
1 ene 2010 año
31.991
-0.362
-1.12%
1 ene 2011 año
31.633
-0.358
-1.12%
1 ene 2012 año
31.3
-0.333
-1.05%
1 ene 2013 año
30.967
-0.333
-1.06%
1 ene 2014 año
30.635
-0.332
-1.07%
1 ene 2015 año
30.305
-0.33
-1.08%
1 ene 2016 año
29.978
-0.327
-1.08%
Ranking de los países por los datos estadísticos actuales


Comentarios: