29
/es/
es
AIzaSyAYiBZKx7MnpbEhh9jyipgxe19OcubqV5w
April 1, 2024
202072
Morocco
MAR
true
2
1
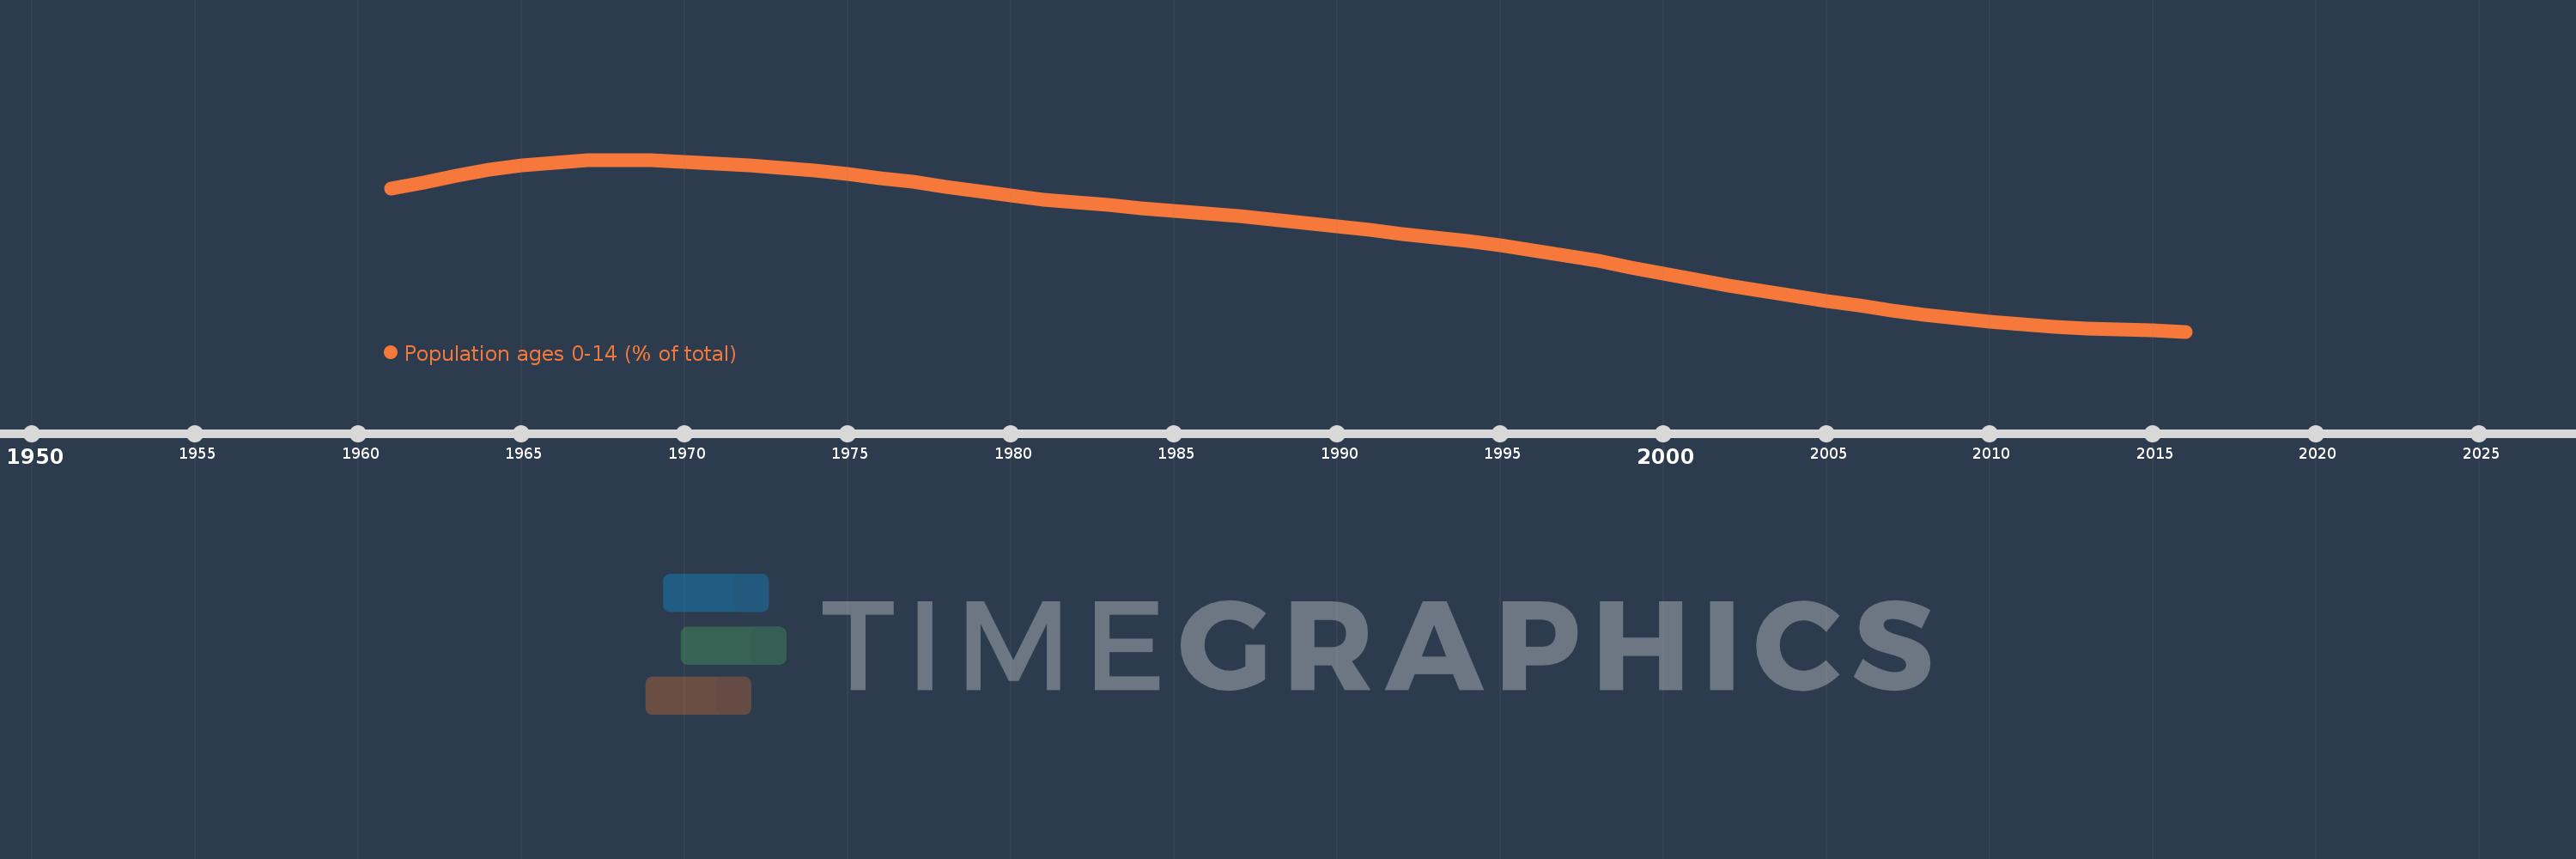
Population ages 0-14 (% of total)
2016,2015,2014,2013,2012,2011,2010,2009,2008,2007,2006,2005,2004,2003,2002,2001,2000,1999,1998,1997,1996,1995,1994,1993,1992,1991,1990,1989,1988,1987,1986,1985,1984,1983,1982,1981,1980,1979,1978,1977,1976,1975,1974,1973,1972,1971,1970,1969,1968,1967,1966,1965,1964,1963,1962,1961
Estas estadísticas en otros países:
AfghanistanAlbaniaAlgeriaAngolaAntigua and BarbudaArab WorldArgentinaArmeniaArubaAustraliaAustriaAzerbaijanBahamas, TheBahrainBangladeshBarbadosBelarusBelgiumBelizeBeninBhutanBoliviaBosnia and HerzegovinaBotswanaBrazilBrunei DarussalamBulgariaBurkina FasoBurundiCabo VerdeCambodiaCameroonCanadaCaribbean small statesCentral African RepublicCentral Europe and the BalticsChadChannel IslandsChileChinaColombiaComorosCongo, Dem. Rep.Congo, Rep.Costa RicaCote d'IvoireCroatiaCubaCuracaoCyprusCzech RepublicDenmarkDjiboutiDominican RepublicEarly-demographic dividendEast Asia & PacificEast Asia & Pacific (excluding high income)East Asia & Pacific (IDA & IBRD countries)EcuadorEgypt, Arab Rep.El SalvadorEquatorial GuineaEritreaEstoniaEthiopiaEuro areaEurope & Central AsiaEurope & Central Asia (excluding high income)Europe & Central Asia (IDA & IBRD countries)European UnionFijiFinlandFragile and conflict affected situationsFranceFrench PolynesiaGabonGambia, TheGeorgiaGermanyGhanaGreeceGrenadaGuamGuatemalaGuineaGuinea-BissauGuyanaHaitiHeavily indebted poor countries (HIPC)High incomeHondurasHong Kong SAR, ChinaHungaryIBRD onlyIcelandIDA & IBRD totalIDA blendIDA onlyIDA totalIndiaIndonesiaIran, Islamic Rep.IraqIrelandIsraelItalyJamaicaJapanJordanKazakhstanKenyaKiribatiKorea, Dem. People’s Rep.Korea, Rep.KosovoKuwaitKyrgyz RepublicLao PDRLate-demographic dividendLatin America & Caribbean Latin America & Caribbean (excluding high income)Latin America & the Caribbean (IDA & IBRD countries)LatviaLeast developed countries: UN classificationLebanonLesothoLiberiaLibyaLithuaniaLow & middle incomeLow incomeLower middle incomeLuxembourgMacao SAR, ChinaMacedonia, FYRMadagascarMalawiMalaysiaMaldivesMaliMaltaMauritaniaMauritiusMexicoMicronesia, Fed. Sts.Middle East & North AfricaMiddle East & North Africa (excluding high income)Middle East & North Africa (IDA & IBRD countries)Middle incomeMoldovaMongoliaMontenegroMoroccoMozambiqueMyanmarNamibiaNepalNetherlandsNew CaledoniaNew ZealandNicaraguaNigerNigeriaNorth AmericaNorwayOECD membersOmanOther small statesPacific island small statesPakistanPanamaPapua New GuineaParaguayPeruPhilippinesPolandPortugalPost-demographic dividendPre-demographic dividendPuerto RicoQatarRomaniaRussian FederationRwandaSamoaSao Tome and PrincipeSaudi ArabiaSenegalSerbiaSeychellesSierra LeoneSingaporeSlovak RepublicSloveniaSmall statesSolomon IslandsSomaliaSouth AfricaSouth AsiaSouth Asia (IDA & IBRD)South SudanSpainSri LankaSt. LuciaSt. Vincent and the GrenadinesSub-Saharan Africa Sub-Saharan Africa (excluding high income)Sub-Saharan Africa (IDA & IBRD countries)SudanSurinameSwazilandSwedenSwitzerlandSyrian Arab RepublicTajikistanTanzaniaThailandTimor-LesteTogoTongaTrinidad and TobagoTunisiaTurkeyTurkmenistanUgandaUkraineUnited Arab EmiratesUnited KingdomUnited StatesUpper middle incomeUruguayUzbekistanVanuatuVenezuela, RBVietnamVirgin Islands (U.S.)West Bank and GazaWorldYemen, Rep.ZambiaZimbabwe línea de tiempo (timeline):
En esta escala de tiempo se presenta un gráfico de 1961 y 2016 de Morocco. Los datos de 1960 están ausentes. El número de observaciones reales por fecha: 56.
Fuente (nombre):
Indicadores del desarrollo mundial
Fuente (organización):
World Bank staff estimates based on age distributions of United Nations Population Division's World Population Prospects.
Categorías:
Education, Health
Se ha actualizado:
23 abr 2017 año
Los indicadores de los cambios de valor en los últimos años
Mínimo:
27.222
1 ene 2016 año
Máximo:
48.196
1 ene 1968 año
A la fecha de observación
Valor
Cambio absoluto
El cambio con respecto al valor anterior
1 ene 1961 año
44.705
+44.705
0.0%
1 ene 1962 año
45.411
+0.705
1.58%
1 ene 1963 año
46.21
+0.799
1.76%
1 ene 1964 año
46.978
+0.768
1.66%
1 ene 1965 año
47.54
+0.562
1.2%
1 ene 1966 año
47.82
+0.28
0.59%
1 ene 1967 año
48.124
+0.303
0.63%
1 ene 1968 año
48.196
+0.072
0.15%
1 ene 1969 año
48.097
-0.099
-0.2%
1 ene 1970 año
47.925
-0.172
-0.36%
1 ene 1971 año
47.719
-0.206
-0.43%
1 ene 1972 año
47.503
-0.216
-0.45%
1 ene 1973 año
47.216
-0.287
-0.61%
1 ene 1974 año
46.863
-0.353
-0.75%
1 ene 1975 año
46.445
-0.418
-0.89%
1 ene 1976 año
45.973
-0.472
-1.02%
1 ene 1977 año
45.474
-0.499
-1.09%
1 ene 1978 año
44.943
-0.531
-1.17%
1 ene 1979 año
44.396
-0.547
-1.22%
1 ene 1980 año
43.859
-0.537
-1.21%
1 ene 1981 año
43.351
-0.508
-1.16%
1 ene 1982 año
42.989
-0.361
-0.83%
1 ene 1983 año
42.644
-0.346
-0.8%
1 ene 1984 año
42.31
-0.334
-0.78%
1 ene 1985 año
41.967
-0.343
-0.81%
1 ene 1986 año
41.595
-0.372
-0.89%
1 ene 1987 año
41.316
-0.279
-0.67%
1 ene 1988 año
40.947
-0.369
-0.89%
1 ene 1989 año
40.521
-0.426
-1.04%
1 ene 1990 año
40.087
-0.435
-1.07%
1 ene 1991 año
39.663
-0.424
-1.06%
1 ene 1992 año
39.145
-0.518
-1.31%
1 ene 1993 año
38.7
-0.445
-1.14%
1 ene 1994 año
38.264
-0.435
-1.12%
1 ene 1995 año
37.752
-0.512
-1.34%
1 ene 1996 año
37.126
-0.626
-1.66%
1 ene 1997 año
36.545
-0.582
-1.57%
1 ene 1998 año
35.837
-0.708
-1.94%
1 ene 1999 año
35.055
-0.781
-2.18%
1 ene 2000 año
34.286
-0.769
-2.19%
1 ene 2001 año
33.569
-0.717
-2.09%
1 ene 2002 año
32.833
-0.735
-2.19%
1 ene 2003 año
32.175
-0.658
-2.01%
1 ene 2004 año
31.57
-0.605
-1.88%
1 ene 2005 año
30.985
-0.584
-1.85%
1 ene 2006 año
30.414
-0.571
-1.84%
1 ene 2007 año
29.841
-0.574
-1.89%
1 ene 2008 año
29.316
-0.525
-1.76%
1 ene 2009 año
28.841
-0.476
-1.62%
1 ene 2010 año
28.425
-0.416
-1.44%
1 ene 2011 año
28.078
-0.346
-1.22%
1 ene 2012 año
27.83
-0.248
-0.88%
1 ene 2013 año
27.619
-0.21
-0.76%
1 ene 2014 año
27.454
-0.165
-0.6%
1 ene 2015 año
27.327
-0.127
-0.46%
1 ene 2016 año
27.222
-0.105
-0.39%
Ranking de los países por los datos estadísticos actuales


Comentarios: