29
/es/
es
AIzaSyAYiBZKx7MnpbEhh9jyipgxe19OcubqV5w
April 1, 2024
79388
Barbados
BRB
true
2
1
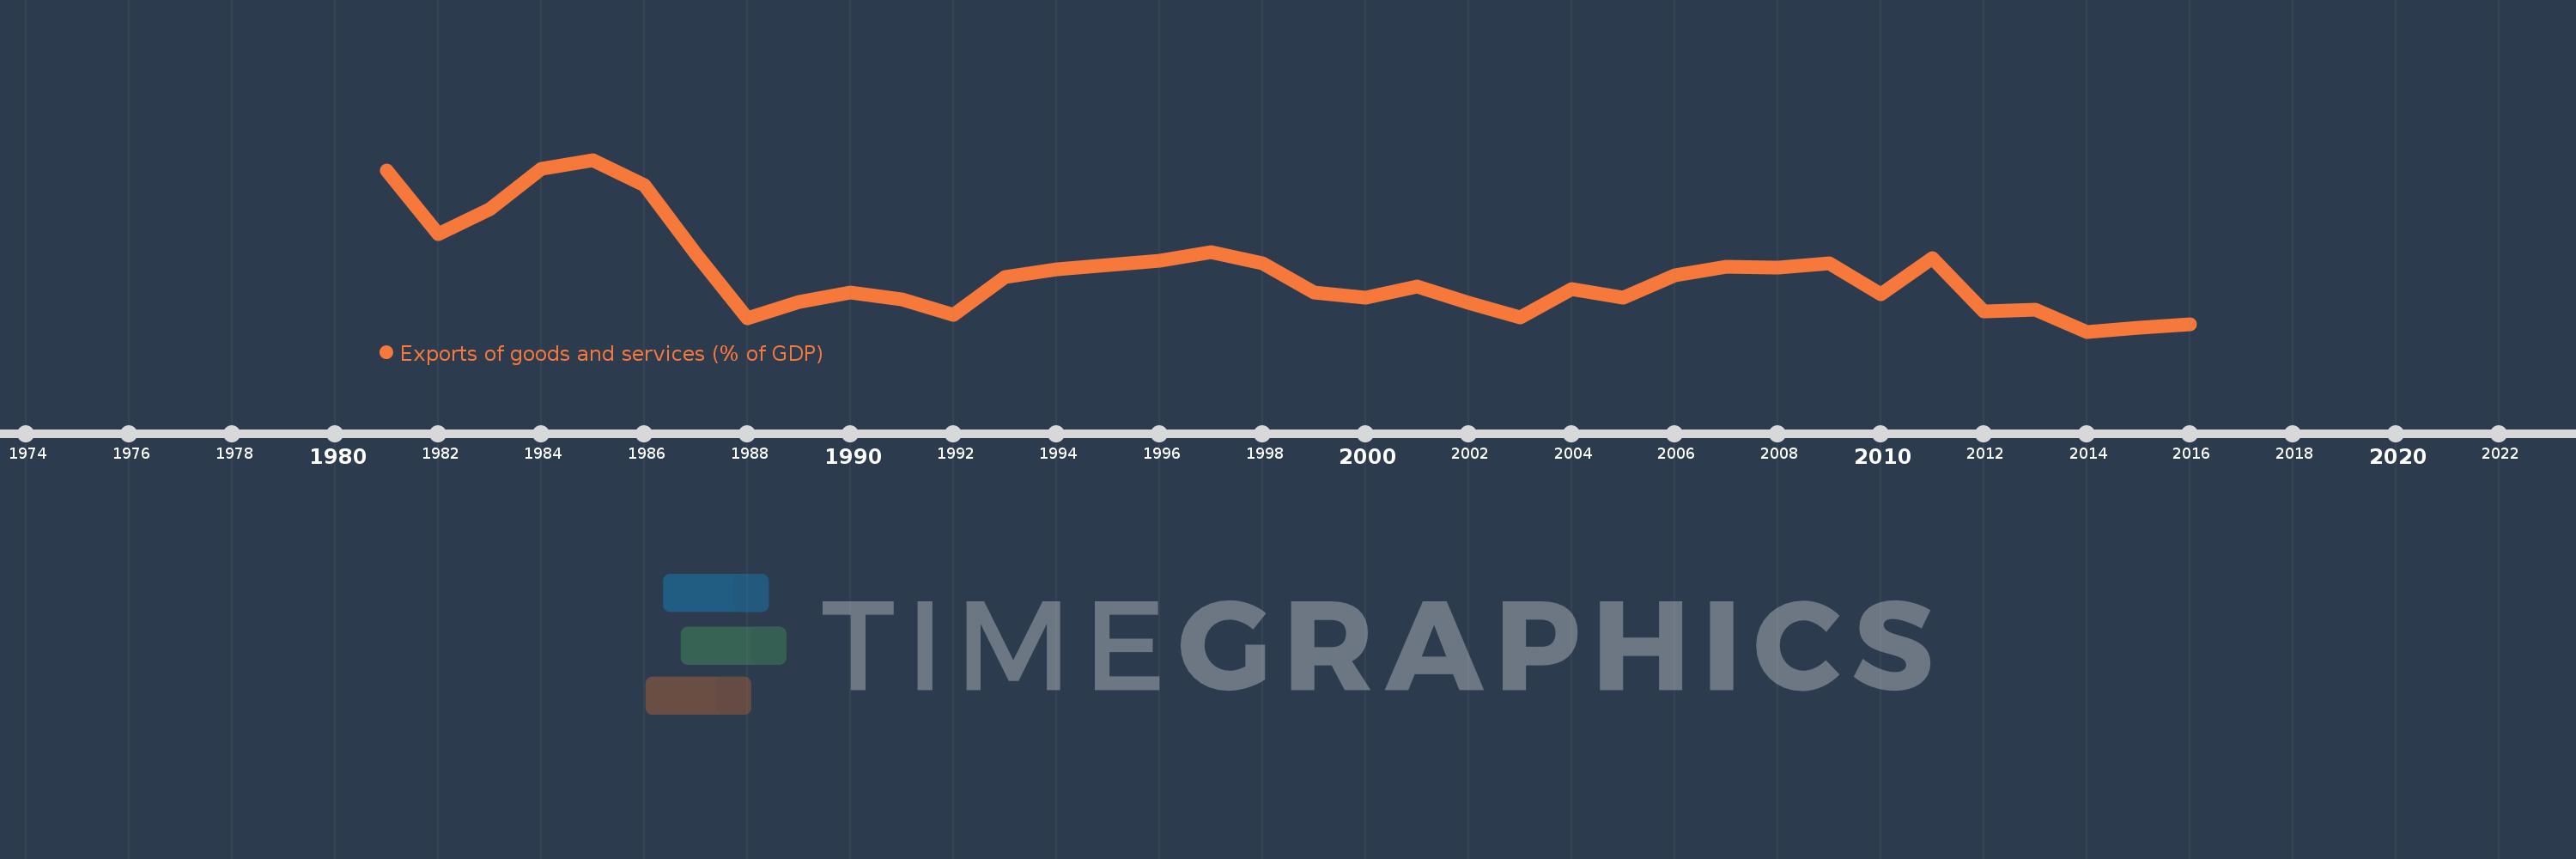
Exports of goods and services (% of GDP)
2016,2015,2014,2013,2012,2011,2010,2009,2008,2007,2006,2005,2004,2003,2002,2001,2000,1999,1998,1997,1996,1995,1994,1993,1992,1991,1990,1989,1988,1987,1986,1985,1984,1983,1982,1981
Estas estadísticas en otros países:
AfghanistanAlbaniaAlgeriaAngolaAntigua and BarbudaArab WorldArgentinaArmeniaArubaAustraliaAustriaAzerbaijanBahamas, TheBahrainBangladeshBarbadosBelarusBelgiumBelizeBeninBermudaBhutanBoliviaBosnia and HerzegovinaBotswanaBrazilBrunei DarussalamBulgariaBurkina FasoBurundiCabo VerdeCambodiaCameroonCanadaCaribbean small statesCentral African RepublicCentral Europe and the BalticsChadChileChinaColombiaComorosCongo, Dem. Rep.Congo, Rep.Costa RicaCote d'IvoireCroatiaCubaCyprusCzech RepublicDenmarkDjiboutiDominicaDominican RepublicEarly-demographic dividendEast Asia & PacificEast Asia & Pacific (excluding high income)East Asia & Pacific (IDA & IBRD countries)EcuadorEgypt, Arab Rep.El SalvadorEquatorial GuineaEritreaEstoniaEthiopiaEuro areaEurope & Central AsiaEurope & Central Asia (excluding high income)Europe & Central Asia (IDA & IBRD countries)European UnionFaroe IslandsFijiFinlandFragile and conflict affected situationsFranceFrench PolynesiaGabonGambia, TheGeorgiaGermanyGhanaGreeceGrenadaGuatemalaGuineaGuinea-BissauGuyanaHaitiHeavily indebted poor countries (HIPC)High incomeHondurasHong Kong SAR, ChinaHungaryIBRD onlyIcelandIDA & IBRD totalIDA blendIDA onlyIDA totalIndiaIndonesiaIran, Islamic Rep.IraqIrelandIsraelItalyJamaicaJapanJordanKazakhstanKenyaKiribatiKorea, Rep.KosovoKuwaitKyrgyz RepublicLao PDRLate-demographic dividendLatin America & Caribbean Latin America & Caribbean (excluding high income)Latin America & the Caribbean (IDA & IBRD countries)LatviaLeast developed countries: UN classificationLebanonLesothoLiberiaLibyaLithuaniaLow & middle incomeLow incomeLower middle incomeLuxembourgMacao SAR, ChinaMacedonia, FYRMadagascarMalawiMalaysiaMaldivesMaliMaltaMauritaniaMauritiusMexicoMicronesia, Fed. Sts.Middle East & North AfricaMiddle East & North Africa (excluding high income)Middle East & North Africa (IDA & IBRD countries)Middle incomeMoldovaMongoliaMontenegroMoroccoMozambiqueMyanmarNamibiaNepalNetherlandsNew CaledoniaNew ZealandNicaraguaNigerNigeriaNorth AmericaNorwayOECD membersOmanOther small statesPacific island small statesPakistanPalauPanamaPapua New GuineaParaguayPeruPhilippinesPolandPortugalPost-demographic dividendPre-demographic dividendPuerto RicoQatarRomaniaRussian FederationRwandaSamoaSaudi ArabiaSenegalSerbiaSeychellesSierra LeoneSingaporeSlovak RepublicSloveniaSmall statesSolomon IslandsSomaliaSouth AfricaSouth AsiaSouth Asia (IDA & IBRD)South SudanSpainSri LankaSt. Kitts and NevisSt. LuciaSt. Vincent and the GrenadinesSub-Saharan Africa Sub-Saharan Africa (excluding high income)Sub-Saharan Africa (IDA & IBRD countries)SudanSurinameSwazilandSwedenSwitzerlandSyrian Arab RepublicTajikistanTanzaniaThailandTimor-LesteTogoTongaTrinidad and TobagoTunisiaTurkeyTurkmenistanUgandaUkraineUnited Arab EmiratesUnited KingdomUnited StatesUpper middle incomeUruguayUzbekistanVanuatuVenezuela, RBVietnamWest Bank and GazaWorldYemen, Rep.ZambiaZimbabwe línea de tiempo (timeline):
En esta escala de tiempo se presenta un gráfico de 1981 y 2016 de Barbados. Los datos de 1980 están ausentes. El número de observaciones reales por fecha: 36.
Fuente (nombre):
Indicadores del desarrollo mundial
Fuente (organización):
World Bank national accounts data, and OECD National Accounts data files.
Categorías:
Economy & Growth, Trade
Se ha actualizado:
23 abr 2017 año
Los indicadores de los cambios de valor en los últimos años
Mínimo:
36.291
1 ene 2014 año
Máximo:
59.559
1 ene 1985 año
A la fecha de observación
Valor
Cambio absoluto
El cambio con respecto al valor anterior
1 ene 1981 año
58.074
+58.074
0.0%
1 ene 1982 año
49.47
-8.604
-14.82%
1 ene 1983 año
52.852
+3.382
6.84%
1 ene 1984 año
58.392
+5.54
10.48%
1 ene 1985 año
59.559
+1.168
2.0%
1 ene 1986 año
56.096
-3.464
-5.82%
1 ene 1987 año
46.812
-9.284
-16.55%
1 ene 1988 año
38.082
-8.73
-18.65%
1 ene 1989 año
40.335
+2.253
5.92%
1 ene 1990 año
41.618
+1.283
3.18%
1 ene 1991 año
40.661
-0.957
-2.3%
1 ene 1992 año
38.593
-2.068
-5.09%
1 ene 1993 año
43.678
+5.085
13.18%
1 ene 1994 año
44.743
+1.066
2.44%
1 ene 1995 año
45.257
+0.513
1.15%
1 ene 1996 año
45.93
+0.673
1.49%
1 ene 1997 año
47.032
+1.102
2.4%
1 ene 1998 año
45.57
-1.463
-3.11%
1 ene 1999 año
41.548
-4.022
-8.83%
1 ene 2000 año
40.853
-0.695
-1.67%
1 ene 2001 año
42.375
+1.523
3.73%
1 ene 2002 año
40.156
-2.22
-5.24%
1 ene 2003 año
38.21
-1.946
-4.85%
1 ene 2004 año
42.101
+3.891
10.18%
1 ene 2005 año
40.858
-1.243
-2.95%
1 ene 2006 año
43.918
+3.06
7.49%
1 ene 2007 año
45.052
+1.133
2.58%
1 ene 2008 año
44.959
-0.092
-0.21%
1 ene 2009 año
45.489
+0.53
1.18%
1 ene 2010 año
41.401
-4.088
-8.99%
1 ene 2011 año
46.203
+4.801
11.6%
1 ene 2012 año
38.979
-7.224
-15.64%
1 ene 2013 año
39.296
+0.317
0.81%
1 ene 2014 año
36.291
-3.005
-7.65%
1 ene 2015 año
36.834
+0.543
1.5%
1 ene 2016 año
37.301
+0.467
1.27%
Ranking de los países por los datos estadísticos actuales


Comentarios: