29
/es/
es
AIzaSyAYiBZKx7MnpbEhh9jyipgxe19OcubqV5w
April 1, 2024
126103
El Salvador
SLV
true
2
1
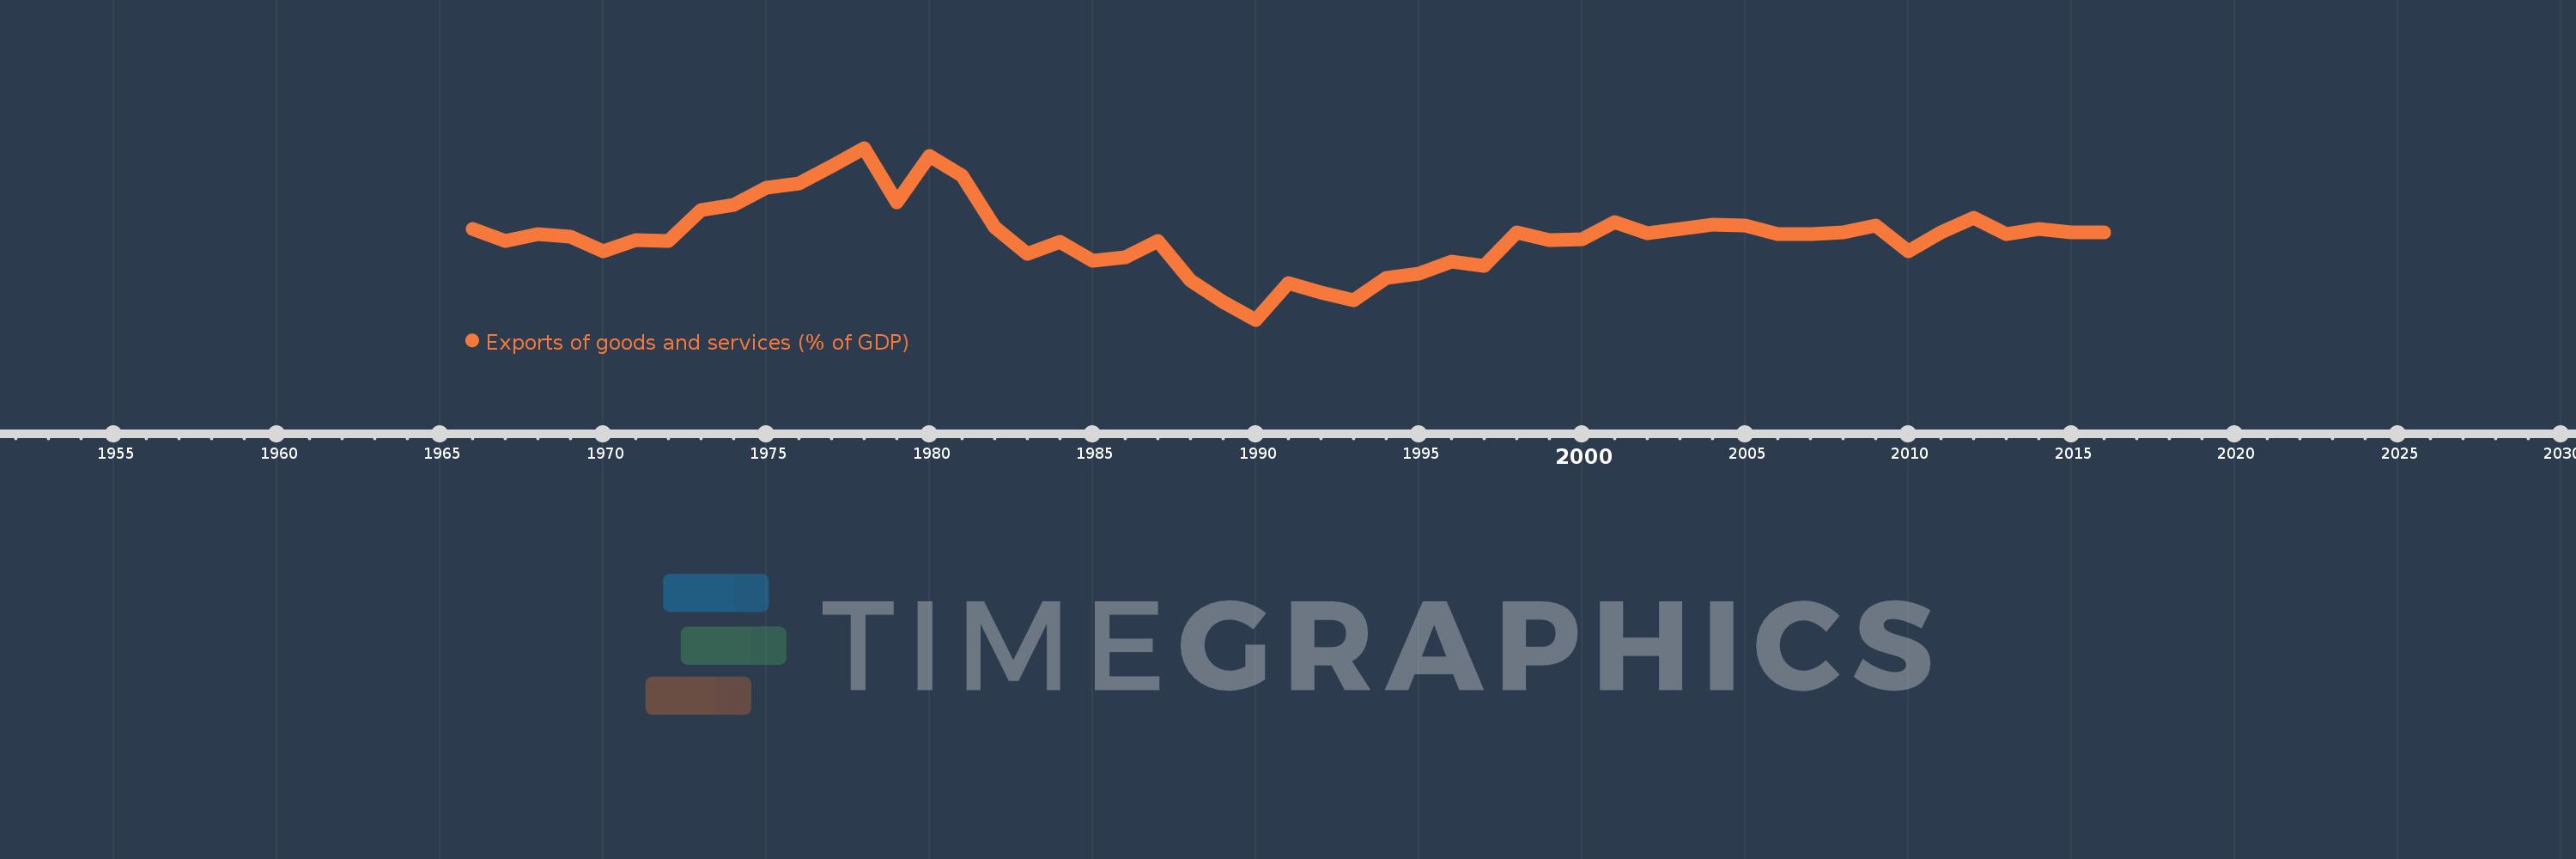
Exports of goods and services (% of GDP)
2016,2015,2014,2013,2012,2011,2010,2009,2008,2007,2006,2005,2004,2003,2002,2001,2000,1999,1998,1997,1996,1995,1994,1993,1992,1991,1990,1989,1988,1987,1986,1985,1984,1983,1982,1981,1980,1979,1978,1977,1976,1975,1974,1973,1972,1971,1970,1969,1968,1967,1966
Estas estadísticas en otros países:
AfghanistanAlbaniaAlgeriaAngolaAntigua and BarbudaArab WorldArgentinaArmeniaArubaAustraliaAustriaAzerbaijanBahamas, TheBahrainBangladeshBarbadosBelarusBelgiumBelizeBeninBermudaBhutanBoliviaBosnia and HerzegovinaBotswanaBrazilBrunei DarussalamBulgariaBurkina FasoBurundiCabo VerdeCambodiaCameroonCanadaCaribbean small statesCentral African RepublicCentral Europe and the BalticsChadChileChinaColombiaComorosCongo, Dem. Rep.Congo, Rep.Costa RicaCote d'IvoireCroatiaCubaCyprusCzech RepublicDenmarkDjiboutiDominicaDominican RepublicEarly-demographic dividendEast Asia & PacificEast Asia & Pacific (excluding high income)East Asia & Pacific (IDA & IBRD countries)EcuadorEgypt, Arab Rep.El SalvadorEquatorial GuineaEritreaEstoniaEthiopiaEuro areaEurope & Central AsiaEurope & Central Asia (excluding high income)Europe & Central Asia (IDA & IBRD countries)European UnionFaroe IslandsFijiFinlandFragile and conflict affected situationsFranceFrench PolynesiaGabonGambia, TheGeorgiaGermanyGhanaGreeceGrenadaGuatemalaGuineaGuinea-BissauGuyanaHaitiHeavily indebted poor countries (HIPC)High incomeHondurasHong Kong SAR, ChinaHungaryIBRD onlyIcelandIDA & IBRD totalIDA blendIDA onlyIDA totalIndiaIndonesiaIran, Islamic Rep.IraqIrelandIsraelItalyJamaicaJapanJordanKazakhstanKenyaKiribatiKorea, Rep.KosovoKuwaitKyrgyz RepublicLao PDRLate-demographic dividendLatin America & Caribbean Latin America & Caribbean (excluding high income)Latin America & the Caribbean (IDA & IBRD countries)LatviaLeast developed countries: UN classificationLebanonLesothoLiberiaLibyaLithuaniaLow & middle incomeLow incomeLower middle incomeLuxembourgMacao SAR, ChinaMacedonia, FYRMadagascarMalawiMalaysiaMaldivesMaliMaltaMauritaniaMauritiusMexicoMicronesia, Fed. Sts.Middle East & North AfricaMiddle East & North Africa (excluding high income)Middle East & North Africa (IDA & IBRD countries)Middle incomeMoldovaMongoliaMontenegroMoroccoMozambiqueMyanmarNamibiaNepalNetherlandsNew CaledoniaNew ZealandNicaraguaNigerNigeriaNorth AmericaNorwayOECD membersOmanOther small statesPacific island small statesPakistanPalauPanamaPapua New GuineaParaguayPeruPhilippinesPolandPortugalPost-demographic dividendPre-demographic dividendPuerto RicoQatarRomaniaRussian FederationRwandaSamoaSaudi ArabiaSenegalSerbiaSeychellesSierra LeoneSingaporeSlovak RepublicSloveniaSmall statesSolomon IslandsSomaliaSouth AfricaSouth AsiaSouth Asia (IDA & IBRD)South SudanSpainSri LankaSt. Kitts and NevisSt. LuciaSt. Vincent and the GrenadinesSub-Saharan Africa Sub-Saharan Africa (excluding high income)Sub-Saharan Africa (IDA & IBRD countries)SudanSurinameSwazilandSwedenSwitzerlandSyrian Arab RepublicTajikistanTanzaniaThailandTimor-LesteTogoTongaTrinidad and TobagoTunisiaTurkeyTurkmenistanUgandaUkraineUnited Arab EmiratesUnited KingdomUnited StatesUpper middle incomeUruguayUzbekistanVanuatuVenezuela, RBVietnamWest Bank and GazaWorldYemen, Rep.ZambiaZimbabwe línea de tiempo (timeline):
En esta escala de tiempo se presenta un gráfico de 1966 y 2016 de El Salvador. Los datos de 1965 están ausentes. El número de observaciones reales por fecha: 51.
Fuente (nombre):
Indicadores del desarrollo mundial
Fuente (organización):
World Bank national accounts data, and OECD National Accounts data files.
Categorías:
Economy & Growth, Trade
Se ha actualizado:
23 abr 2017 año
Los indicadores de los cambios de valor en los últimos años
Mínimo:
13.238
1 ene 1990 año
Máximo:
38.165
1 ene 1978 año
A la fecha de observación
Valor
Cambio absoluto
El cambio con respecto al valor anterior
1 ene 1966 año
26.387
+26.387
0.0%
1 ene 1967 año
24.662
-1.724
-6.53%
1 ene 1968 año
25.638
+0.976
3.96%
1 ene 1969 año
25.349
-0.29
-1.13%
1 ene 1970 año
23.187
-2.162
-8.53%
1 ene 1971 año
24.835
+1.648
7.11%
1 ene 1972 año
24.632
-0.203
-0.82%
1 ene 1973 año
29.095
+4.463
18.12%
1 ene 1974 año
29.96
+0.865
2.97%
1 ene 1975 año
32.418
+2.458
8.2%
1 ene 1976 año
33.047
+0.629
1.94%
1 ene 1977 año
35.544
+2.497
7.56%
1 ene 1978 año
38.165
+2.621
7.37%
1 ene 1979 año
30.266
-7.899
-20.7%
1 ene 1980 año
36.972
+6.705
22.15%
1 ene 1981 año
34.162
-2.81
-7.6%
1 ene 1982 año
26.679
-7.483
-21.9%
1 ene 1983 año
22.777
-3.901
-14.62%
1 ene 1984 año
24.489
+1.711
7.51%
1 ene 1985 año
21.754
-2.734
-11.17%
1 ene 1986 año
22.324
+0.57
2.62%
1 ene 1987 año
24.668
+2.344
10.5%
1 ene 1988 año
18.992
-5.676
-23.01%
1 ene 1989 año
15.811
-3.182
-16.75%
1 ene 1990 año
13.238
-2.573
-16.27%
1 ene 1991 año
18.557
+5.319
40.18%
1 ene 1992 año
17.213
-1.344
-7.24%
1 ene 1993 año
16.09
-1.124
-6.53%
1 ene 1994 año
19.356
+3.266
20.3%
1 ene 1995 año
19.966
+0.611
3.15%
1 ene 1996 año
21.638
+1.671
8.37%
1 ene 1997 año
21.076
-0.562
-2.6%
1 ene 1998 año
25.894
+4.818
22.86%
1 ene 1999 año
24.79
-1.104
-4.26%
1 ene 2000 año
24.936
+0.146
0.59%
1 ene 2001 año
27.4
+2.464
9.88%
1 ene 2002 año
25.831
-1.569
-5.73%
1 ene 2003 año
26.367
+0.535
2.07%
1 ene 2004 año
27.068
+0.701
2.66%
1 ene 2005 año
26.959
-0.109
-0.4%
1 ene 2006 año
25.64
-1.319
-4.89%
1 ene 2007 año
25.682
+0.042
0.17%
1 ene 2008 año
25.883
+0.201
0.78%
1 ene 2009 año
26.882
+0.999
3.86%
1 ene 2010 año
23.197
-3.685
-13.71%
1 ene 2011 año
25.925
+2.728
11.76%
1 ene 2012 año
27.98
+2.055
7.93%
1 ene 2013 año
25.622
-2.358
-8.43%
1 ene 2014 año
26.372
+0.749
2.92%
1 ene 2015 año
25.871
-0.501
-1.9%
1 ene 2016 año
25.959
+0.088
0.34%
Ranking de los países por los datos estadísticos actuales


Comentarios: