29
/es/
es
AIzaSyAYiBZKx7MnpbEhh9jyipgxe19OcubqV5w
April 1, 2024
103537
Chad
TCD
true
2
1
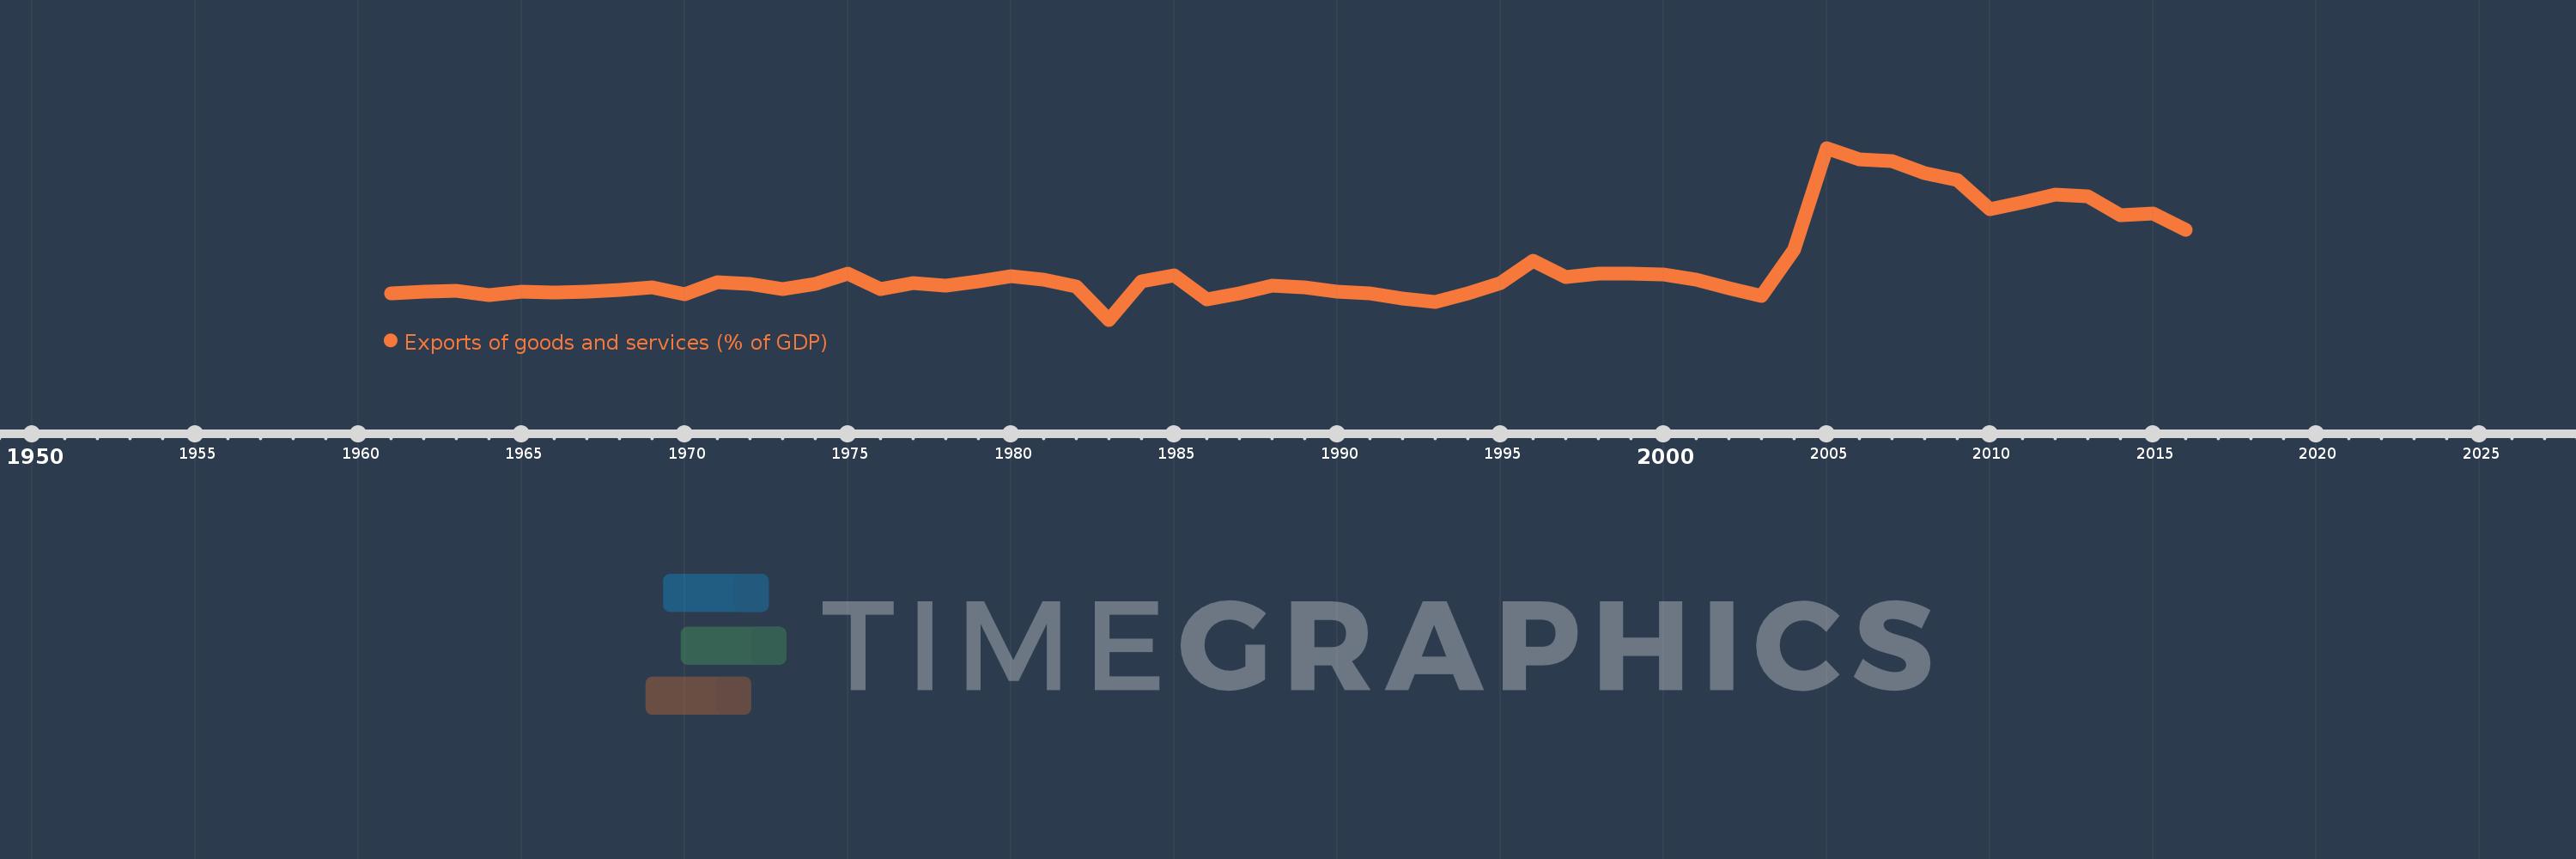
Exports of goods and services (% of GDP)
2016,2015,2014,2013,2012,2011,2010,2009,2008,2007,2006,2005,2004,2003,2002,2001,2000,1999,1998,1997,1996,1995,1994,1993,1992,1991,1990,1989,1988,1987,1986,1985,1984,1983,1982,1981,1980,1979,1978,1977,1976,1975,1974,1973,1972,1971,1970,1969,1968,1967,1966,1965,1964,1963,1962,1961
Estas estadísticas en otros países:
AfghanistanAlbaniaAlgeriaAngolaAntigua and BarbudaArab WorldArgentinaArmeniaArubaAustraliaAustriaAzerbaijanBahamas, TheBahrainBangladeshBarbadosBelarusBelgiumBelizeBeninBermudaBhutanBoliviaBosnia and HerzegovinaBotswanaBrazilBrunei DarussalamBulgariaBurkina FasoBurundiCabo VerdeCambodiaCameroonCanadaCaribbean small statesCentral African RepublicCentral Europe and the BalticsChadChileChinaColombiaComorosCongo, Dem. Rep.Congo, Rep.Costa RicaCote d'IvoireCroatiaCubaCyprusCzech RepublicDenmarkDjiboutiDominicaDominican RepublicEarly-demographic dividendEast Asia & PacificEast Asia & Pacific (excluding high income)East Asia & Pacific (IDA & IBRD countries)EcuadorEgypt, Arab Rep.El SalvadorEquatorial GuineaEritreaEstoniaEthiopiaEuro areaEurope & Central AsiaEurope & Central Asia (excluding high income)Europe & Central Asia (IDA & IBRD countries)European UnionFaroe IslandsFijiFinlandFragile and conflict affected situationsFranceFrench PolynesiaGabonGambia, TheGeorgiaGermanyGhanaGreeceGrenadaGuatemalaGuineaGuinea-BissauGuyanaHaitiHeavily indebted poor countries (HIPC)High incomeHondurasHong Kong SAR, ChinaHungaryIBRD onlyIcelandIDA & IBRD totalIDA blendIDA onlyIDA totalIndiaIndonesiaIran, Islamic Rep.IraqIrelandIsraelItalyJamaicaJapanJordanKazakhstanKenyaKiribatiKorea, Rep.KosovoKuwaitKyrgyz RepublicLao PDRLate-demographic dividendLatin America & Caribbean Latin America & Caribbean (excluding high income)Latin America & the Caribbean (IDA & IBRD countries)LatviaLeast developed countries: UN classificationLebanonLesothoLiberiaLibyaLithuaniaLow & middle incomeLow incomeLower middle incomeLuxembourgMacao SAR, ChinaMacedonia, FYRMadagascarMalawiMalaysiaMaldivesMaliMaltaMauritaniaMauritiusMexicoMicronesia, Fed. Sts.Middle East & North AfricaMiddle East & North Africa (excluding high income)Middle East & North Africa (IDA & IBRD countries)Middle incomeMoldovaMongoliaMontenegroMoroccoMozambiqueMyanmarNamibiaNepalNetherlandsNew CaledoniaNew ZealandNicaraguaNigerNigeriaNorth AmericaNorwayOECD membersOmanOther small statesPacific island small statesPakistanPalauPanamaPapua New GuineaParaguayPeruPhilippinesPolandPortugalPost-demographic dividendPre-demographic dividendPuerto RicoQatarRomaniaRussian FederationRwandaSamoaSaudi ArabiaSenegalSerbiaSeychellesSierra LeoneSingaporeSlovak RepublicSloveniaSmall statesSolomon IslandsSomaliaSouth AfricaSouth AsiaSouth Asia (IDA & IBRD)South SudanSpainSri LankaSt. Kitts and NevisSt. LuciaSt. Vincent and the GrenadinesSub-Saharan Africa Sub-Saharan Africa (excluding high income)Sub-Saharan Africa (IDA & IBRD countries)SudanSurinameSwazilandSwedenSwitzerlandSyrian Arab RepublicTajikistanTanzaniaThailandTimor-LesteTogoTongaTrinidad and TobagoTunisiaTurkeyTurkmenistanUgandaUkraineUnited Arab EmiratesUnited KingdomUnited StatesUpper middle incomeUruguayUzbekistanVanuatuVenezuela, RBVietnamWest Bank and GazaWorldYemen, Rep.ZambiaZimbabwe línea de tiempo (timeline):
En esta escala de tiempo se presenta un gráfico de 1961 y 2016 de Chad. Los datos de 1960 están ausentes. El número de observaciones reales por fecha: 56.
Fuente (nombre):
Indicadores del desarrollo mundial
Fuente (organización):
World Bank national accounts data, and OECD National Accounts data files.
Categorías:
Economy & Growth, Trade
Se ha actualizado:
23 abr 2017 año
Los indicadores de los cambios de valor en los últimos años
Mínimo:
6.562
1 ene 1983 año
Máximo:
51.009
1 ene 2005 año
A la fecha de observación
Valor
Cambio absoluto
El cambio con respecto al valor anterior
1 ene 1961 año
13.39
+13.39
0.0%
1 ene 1962 año
13.911
+0.521
3.89%
1 ene 1963 año
14.03
+0.119
0.86%
1 ene 1964 año
12.948
-1.082
-7.71%
1 ene 1965 año
13.728
+0.779
6.02%
1 ene 1966 año
13.5
-0.227
-1.66%
1 ene 1967 año
13.913
+0.412
3.05%
1 ene 1968 año
14.362
+0.449
3.23%
1 ene 1969 año
14.941
+0.579
4.03%
1 ene 1970 año
13.207
-1.734
-11.61%
1 ene 1971 año
16.26
+3.053
23.12%
1 ene 1972 año
15.912
-0.347
-2.14%
1 ene 1973 año
14.565
-1.347
-8.47%
1 ene 1974 año
15.729
+1.164
7.99%
1 ene 1975 año
18.391
+2.662
16.93%
1 ene 1976 año
14.403
-3.988
-21.69%
1 ene 1977 año
16.084
+1.681
11.67%
1 ene 1978 año
15.354
-0.73
-4.54%
1 ene 1979 año
16.423
+1.069
6.96%
1 ene 1980 año
17.779
+1.356
8.26%
1 ene 1981 año
16.945
-0.834
-4.69%
1 ene 1982 año
15.1
-1.844
-10.88%
1 ene 1983 año
6.562
-8.538
-56.54%
1 ene 1984 año
16.419
+9.857
150.21%
1 ene 1985 año
18.018
+1.599
9.74%
1 ene 1986 año
11.907
-6.111
-33.92%
1 ene 1987 año
13.394
+1.487
12.49%
1 ene 1988 año
15.449
+2.055
15.34%
1 ene 1989 año
15.019
-0.43
-2.78%
1 ene 1990 año
13.781
-1.238
-8.24%
1 ene 1991 año
13.48
-0.301
-2.19%
1 ene 1992 año
11.952
-1.529
-11.34%
1 ene 1993 año
11.091
-0.861
-7.2%
1 ene 1994 año
13.323
+2.233
20.13%
1 ene 1995 año
16.106
+2.782
20.88%
1 ene 1996 año
21.929
+5.823
36.16%
1 ene 1997 año
17.544
-4.386
-20.0%
1 ene 1998 año
18.544
+1.0
5.7%
1 ene 1999 año
18.492
-0.052
-0.28%
1 ene 2000 año
18.318
-0.174
-0.94%
1 ene 2001 año
16.89
-1.428
-7.8%
1 ene 2002 año
14.666
-2.224
-13.17%
1 ene 2003 año
12.69
-1.976
-13.47%
1 ene 2004 año
24.633
+11.943
94.11%
1 ene 2005 año
51.009
+26.376
107.08%
1 ene 2006 año
47.977
-3.032
-5.94%
1 ene 2007 año
47.584
-0.393
-0.82%
1 ene 2008 año
44.503
-3.081
-6.47%
1 ene 2009 año
42.695
-1.809
-4.06%
1 ene 2010 año
35.138
-7.556
-17.7%
1 ene 2011 año
36.846
+1.707
4.86%
1 ene 2012 año
38.877
+2.032
5.51%
1 ene 2013 año
38.468
-0.409
-1.05%
1 ene 2014 año
33.566
-4.902
-12.74%
1 ene 2015 año
34.161
+0.596
1.77%
1 ene 2016 año
29.833
-4.329
-12.67%
Ranking de los países por los datos estadísticos actuales


Comentarios: