29
/es/
es
AIzaSyAYiBZKx7MnpbEhh9jyipgxe19OcubqV5w
April 1, 2024
171647
Kuwait
KWT
true
2
1
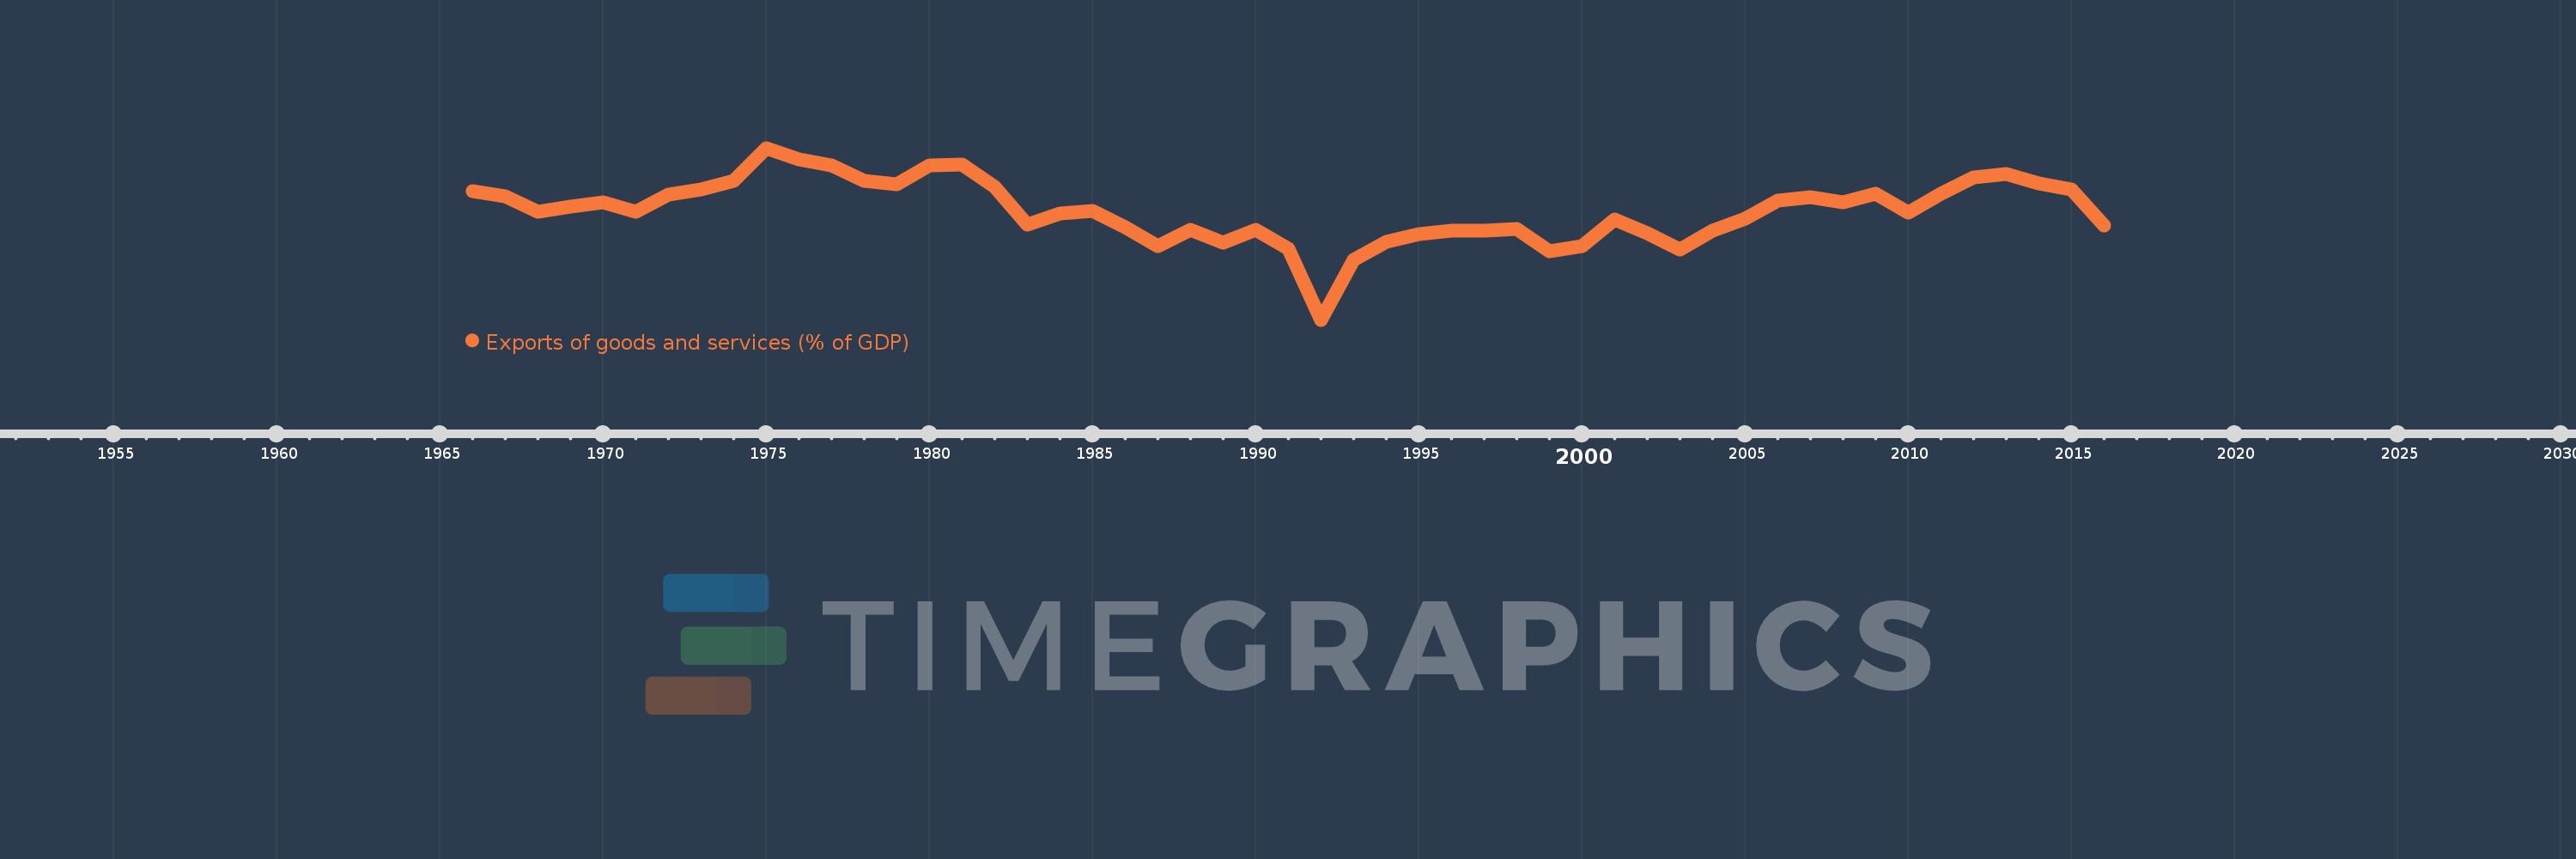
Exports of goods and services (% of GDP)
2016,2015,2014,2013,2012,2011,2010,2009,2008,2007,2006,2005,2004,2003,2002,2001,2000,1999,1998,1997,1996,1995,1994,1993,1992,1991,1990,1989,1988,1987,1986,1985,1984,1983,1982,1981,1980,1979,1978,1977,1976,1975,1974,1973,1972,1971,1970,1969,1968,1967,1966
Estas estadísticas en otros países:
AfghanistanAlbaniaAlgeriaAngolaAntigua and BarbudaArab WorldArgentinaArmeniaArubaAustraliaAustriaAzerbaijanBahamas, TheBahrainBangladeshBarbadosBelarusBelgiumBelizeBeninBermudaBhutanBoliviaBosnia and HerzegovinaBotswanaBrazilBrunei DarussalamBulgariaBurkina FasoBurundiCabo VerdeCambodiaCameroonCanadaCaribbean small statesCentral African RepublicCentral Europe and the BalticsChadChileChinaColombiaComorosCongo, Dem. Rep.Congo, Rep.Costa RicaCote d'IvoireCroatiaCubaCyprusCzech RepublicDenmarkDjiboutiDominicaDominican RepublicEarly-demographic dividendEast Asia & PacificEast Asia & Pacific (excluding high income)East Asia & Pacific (IDA & IBRD countries)EcuadorEgypt, Arab Rep.El SalvadorEquatorial GuineaEritreaEstoniaEthiopiaEuro areaEurope & Central AsiaEurope & Central Asia (excluding high income)Europe & Central Asia (IDA & IBRD countries)European UnionFaroe IslandsFijiFinlandFragile and conflict affected situationsFranceFrench PolynesiaGabonGambia, TheGeorgiaGermanyGhanaGreeceGrenadaGuatemalaGuineaGuinea-BissauGuyanaHaitiHeavily indebted poor countries (HIPC)High incomeHondurasHong Kong SAR, ChinaHungaryIBRD onlyIcelandIDA & IBRD totalIDA blendIDA onlyIDA totalIndiaIndonesiaIran, Islamic Rep.IraqIrelandIsraelItalyJamaicaJapanJordanKazakhstanKenyaKiribatiKorea, Rep.KosovoKuwaitKyrgyz RepublicLao PDRLate-demographic dividendLatin America & Caribbean Latin America & Caribbean (excluding high income)Latin America & the Caribbean (IDA & IBRD countries)LatviaLeast developed countries: UN classificationLebanonLesothoLiberiaLibyaLithuaniaLow & middle incomeLow incomeLower middle incomeLuxembourgMacao SAR, ChinaMacedonia, FYRMadagascarMalawiMalaysiaMaldivesMaliMaltaMauritaniaMauritiusMexicoMicronesia, Fed. Sts.Middle East & North AfricaMiddle East & North Africa (excluding high income)Middle East & North Africa (IDA & IBRD countries)Middle incomeMoldovaMongoliaMontenegroMoroccoMozambiqueMyanmarNamibiaNepalNetherlandsNew CaledoniaNew ZealandNicaraguaNigerNigeriaNorth AmericaNorwayOECD membersOmanOther small statesPacific island small statesPakistanPalauPanamaPapua New GuineaParaguayPeruPhilippinesPolandPortugalPost-demographic dividendPre-demographic dividendPuerto RicoQatarRomaniaRussian FederationRwandaSamoaSaudi ArabiaSenegalSerbiaSeychellesSierra LeoneSingaporeSlovak RepublicSloveniaSmall statesSolomon IslandsSomaliaSouth AfricaSouth AsiaSouth Asia (IDA & IBRD)South SudanSpainSri LankaSt. Kitts and NevisSt. LuciaSt. Vincent and the GrenadinesSub-Saharan Africa Sub-Saharan Africa (excluding high income)Sub-Saharan Africa (IDA & IBRD countries)SudanSurinameSwazilandSwedenSwitzerlandSyrian Arab RepublicTajikistanTanzaniaThailandTimor-LesteTogoTongaTrinidad and TobagoTunisiaTurkeyTurkmenistanUgandaUkraineUnited Arab EmiratesUnited KingdomUnited StatesUpper middle incomeUruguayUzbekistanVanuatuVenezuela, RBVietnamWest Bank and GazaWorldYemen, Rep.ZambiaZimbabwe línea de tiempo (timeline):
En esta escala de tiempo se presenta un gráfico de 1966 y 2016 de Kuwait. Los datos de 1965 están ausentes. El número de observaciones reales por fecha: 51.
Fuente (nombre):
Indicadores del desarrollo mundial
Fuente (organización):
World Bank national accounts data, and OECD National Accounts data files.
Categorías:
Economy & Growth, Trade
Se ha actualizado:
23 abr 2017 año
Los indicadores de los cambios de valor en los últimos años
Mínimo:
16.902
1 ene 1992 año
Máximo:
84.959
1 ene 1975 año
A la fecha de observación
Valor
Cambio absoluto
El cambio con respecto al valor anterior
1 ene 1966 año
67.69
+67.69
0.0%
1 ene 1967 año
65.691
-1.999
-2.95%
1 ene 1968 año
59.518
-6.173
-9.4%
1 ene 1969 año
61.725
+2.206
3.71%
1 ene 1970 año
63.498
+1.774
2.87%
1 ene 1971 año
59.817
-3.682
-5.8%
1 ene 1972 año
66.348
+6.531
10.92%
1 ene 1973 año
68.6
+2.251
3.39%
1 ene 1974 año
71.934
+3.335
4.86%
1 ene 1975 año
84.959
+13.025
18.11%
1 ene 1976 año
80.47
-4.489
-5.28%
1 ene 1977 año
77.933
-2.537
-3.15%
1 ene 1978 año
72.026
-5.907
-7.58%
1 ene 1979 año
70.539
-1.487
-2.06%
1 ene 1980 año
77.97
+7.431
10.53%
1 ene 1981 año
78.349
+0.379
0.49%
1 ene 1982 año
69.498
-8.851
-11.3%
1 ene 1983 año
54.505
-14.993
-21.57%
1 ene 1984 año
59.129
+4.625
8.48%
1 ene 1985 año
60.113
+0.984
1.66%
1 ene 1986 año
53.675
-6.438
-10.71%
1 ene 1987 año
46.187
-7.488
-13.95%
1 ene 1988 año
52.54
+6.354
13.76%
1 ene 1989 año
47.565
-4.976
-9.47%
1 ene 1990 año
52.402
+4.837
10.17%
1 ene 1991 año
44.939
-7.463
-14.24%
1 ene 1992 año
16.902
-28.037
-62.39%
1 ene 1993 año
40.47
+23.568
139.44%
1 ene 1994 año
47.771
+7.301
18.04%
1 ene 1995 año
50.854
+3.082
6.45%
1 ene 1996 año
52.354
+1.5
2.95%
1 ene 1997 año
52.284
-0.07
-0.13%
1 ene 1998 año
52.854
+0.57
1.09%
1 ene 1999 año
43.859
-8.995
-17.02%
1 ene 2000 año
45.937
+2.078
4.74%
1 ene 2001 año
56.474
+10.537
22.94%
1 ene 2002 año
51.304
-5.17
-9.15%
1 ene 2003 año
44.616
-6.688
-13.04%
1 ene 2004 año
52.092
+7.476
16.76%
1 ene 2005 año
56.916
+4.824
9.26%
1 ene 2006 año
63.977
+7.06
12.41%
1 ene 2007 año
65.545
+1.568
2.45%
1 ene 2008 año
63.414
-2.13
-3.25%
1 ene 2009 año
66.759
+3.345
5.27%
1 ene 2010 año
59.469
-7.29
-10.92%
1 ene 2011 año
66.674
+7.204
12.11%
1 ene 2012 año
73.218
+6.544
9.82%
1 ene 2013 año
74.732
+1.514
2.07%
1 ene 2014 año
70.861
-3.87
-5.18%
1 ene 2015 año
68.506
-2.355
-3.32%
1 ene 2016 año
54.379
-14.127
-20.62%
Ranking de los países por los datos estadísticos actuales


Comentarios: