29
/es/
es
AIzaSyAYiBZKx7MnpbEhh9jyipgxe19OcubqV5w
April 1, 2024
79306
Barbados
BRB
true
2
1
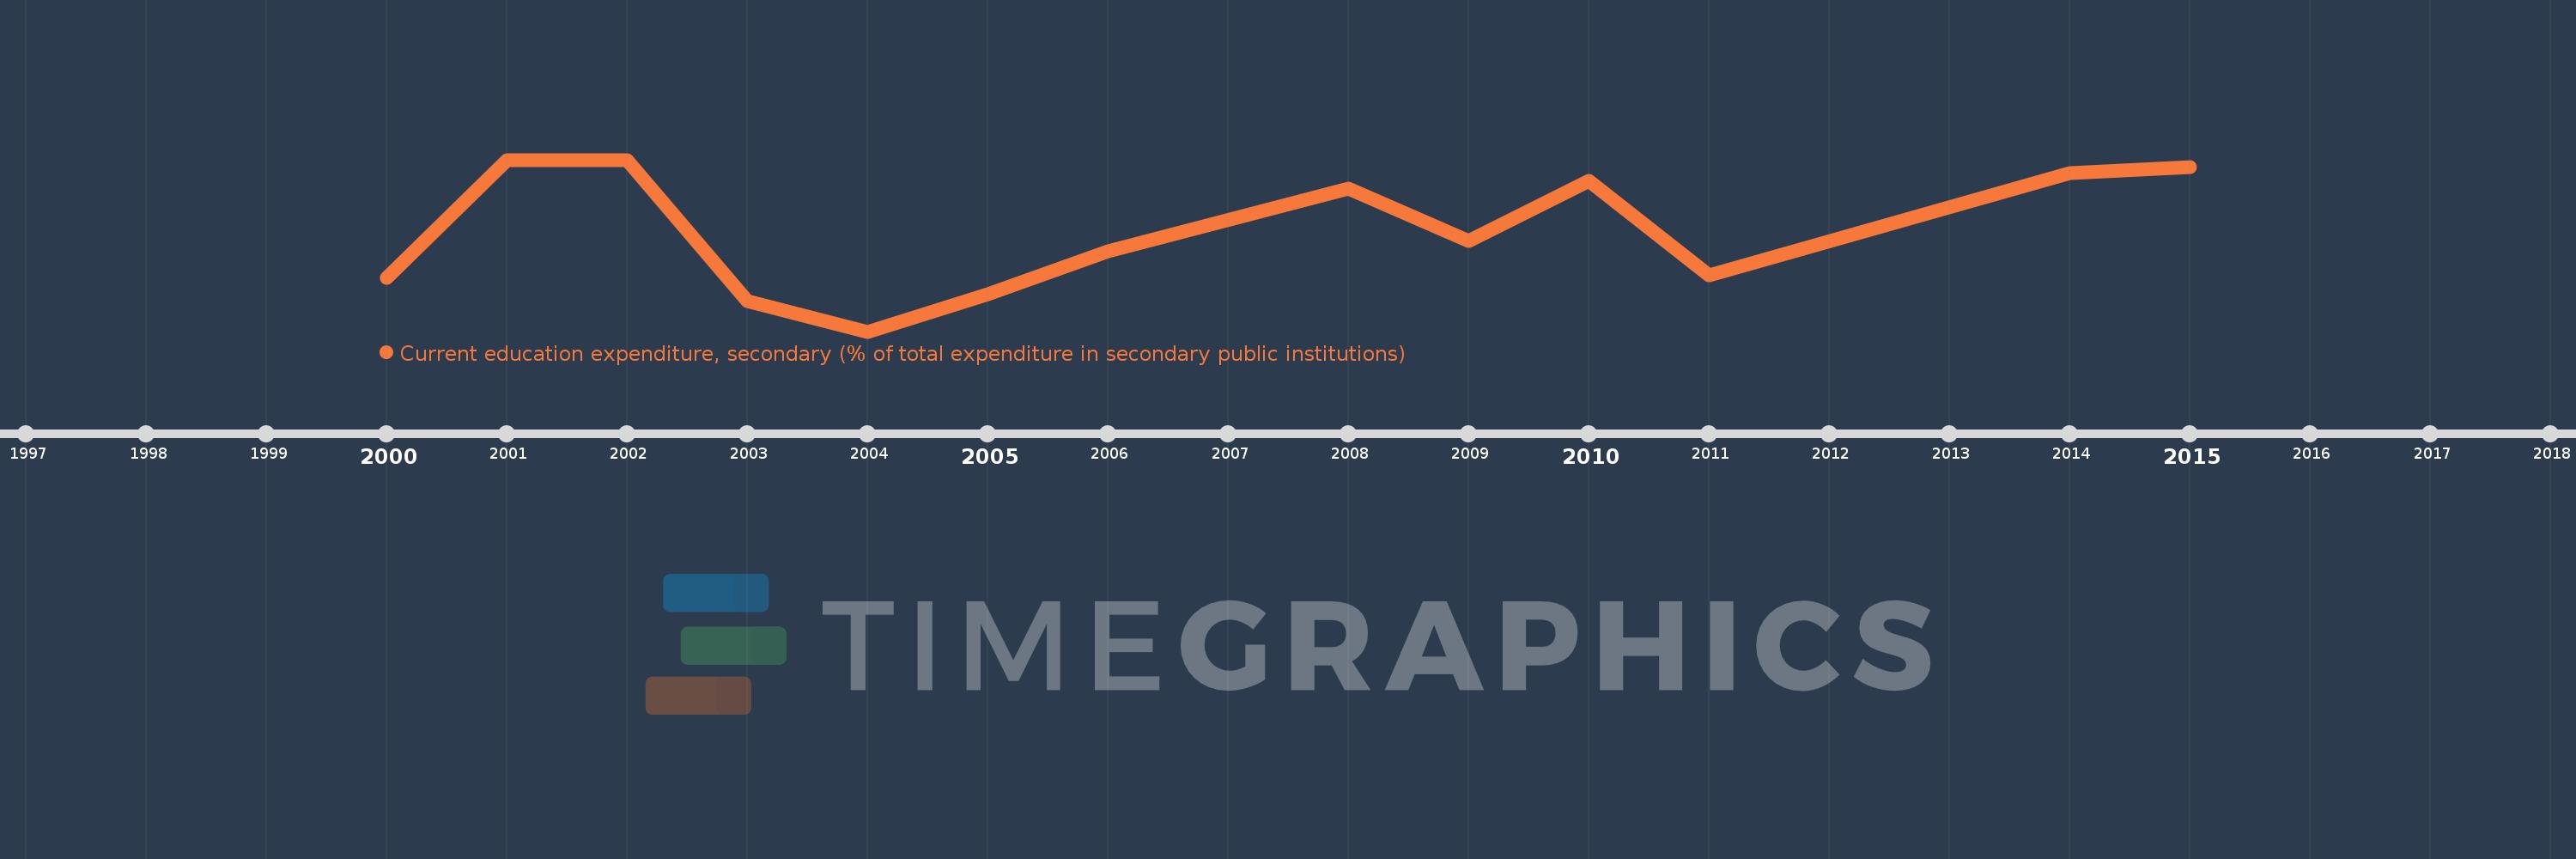
Current education expenditure, secondary (% of total expenditure in secondary public institutions)
2015,2014,2011,2010,2009,2008,2006,2005,2004,2003,2002,2001,2000
Estas estadísticas en otros países:
línea de tiempo (timeline):
En esta escala de tiempo se presenta un gráfico de 2000 y 2015 de Barbados. Los datos de 1999 están ausentes. El número de observaciones reales por fecha: 13.
Fuente (nombre):
Indicadores del desarrollo mundial
Fuente (organización):
United Nations Educational, Scientific, and Cultural Organization (UNESCO) Institute for Statistics.
Categorías:
Education
Se ha actualizado:
23 abr 2017 año
Los indicadores de los cambios de valor en los últimos años
Mínimo:
84.252
1 ene 2004 año
Máximo:
100.0
1 ene 2001 año
A la fecha de observación
Valor
Cambio absoluto
El cambio con respecto al valor anterior
1 ene 2000 año
89.145
+89.145
0.0%
1 ene 2001 año
100.0
+10.855
12.18%
1 ene 2002 año
99.954
-0.046
-0.05%
1 ene 2003 año
87.041
-12.913
-12.92%
1 ene 2004 año
84.252
-2.789
-3.2%
1 ene 2005 año
87.655
+3.403
4.04%
1 ene 2006 año
91.648
+3.993
4.56%
1 ene 2008 año
97.386
+5.739
6.26%
1 ene 2009 año
92.594
-4.793
-4.92%
1 ene 2010 año
98.097
+5.503
5.94%
1 ene 2011 año
89.379
-8.718
-8.89%
1 ene 2014 año
98.744
+9.365
10.48%
1 ene 2015 año
99.354
+0.61
0.62%
Ranking de los países por los datos estadísticos actuales


Comentarios: