29
/es/
es
AIzaSyAYiBZKx7MnpbEhh9jyipgxe19OcubqV5w
April 1, 2024
191252
Malta
MLT
true
2
1
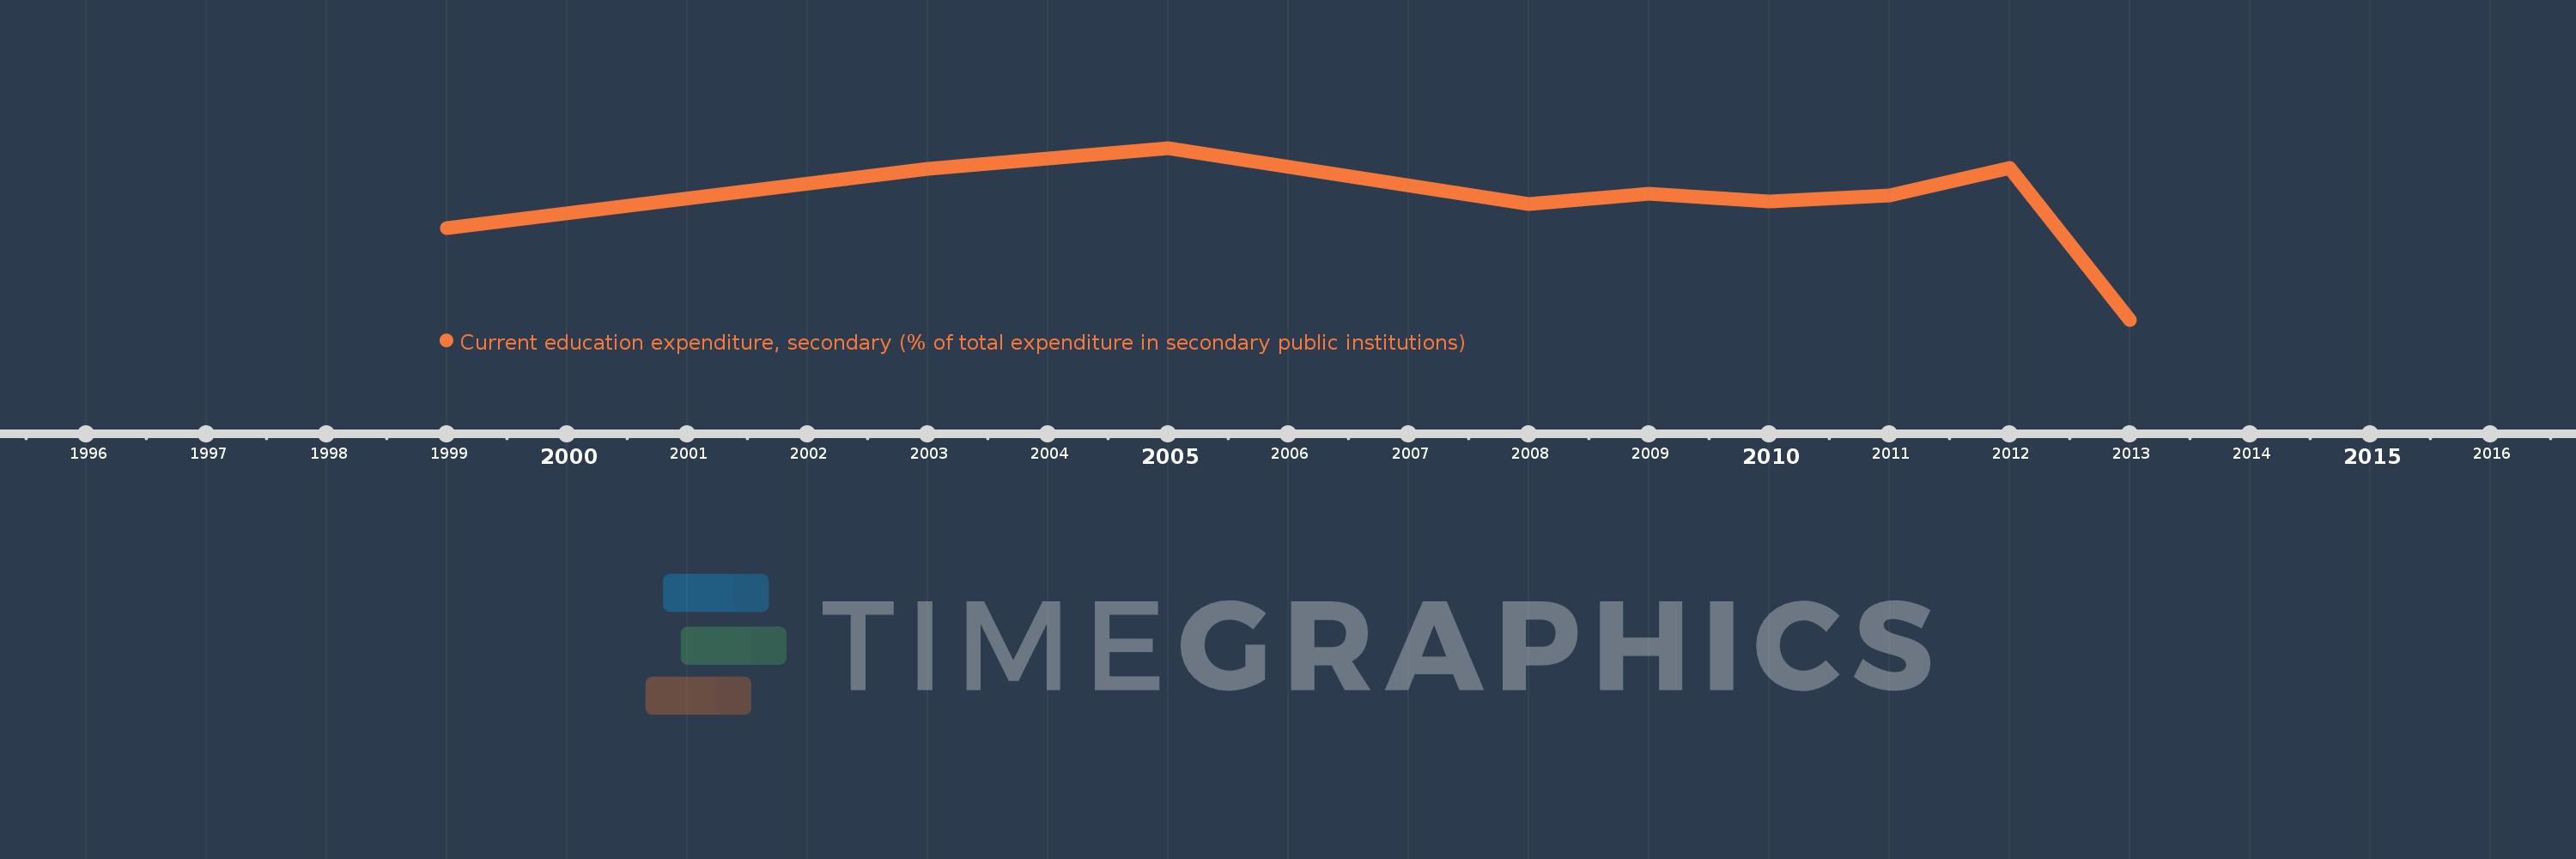
Current education expenditure, secondary (% of total expenditure in secondary public institutions)
2013,2012,2011,2010,2009,2008,2005,2003,1999
Estas estadísticas en otros países:
línea de tiempo (timeline):
En esta escala de tiempo se presenta un gráfico de 1999 y 2013 de Malta. Los datos de 1998 están ausentes. El número de observaciones reales por fecha: 9.
Fuente (nombre):
Indicadores del desarrollo mundial
Fuente (organización):
United Nations Educational, Scientific, and Cultural Organization (UNESCO) Institute for Statistics.
Categorías:
Education
Se ha actualizado:
23 abr 2017 año
Los indicadores de los cambios de valor en los últimos años
Mínimo:
75.006
1 ene 2013 año
Máximo:
99.165
1 ene 2005 año
A la fecha de observación
Valor
Cambio absoluto
El cambio con respecto al valor anterior
1 ene 1999 año
87.859
+87.859
0.0%
1 ene 2003 año
96.23
+8.371
9.53%
1 ene 2005 año
99.165
+2.935
3.05%
1 ene 2008 año
91.287
-7.878
-7.94%
1 ene 2009 año
92.764
+1.477
1.62%
1 ene 2010 año
91.653
-1.111
-1.2%
1 ene 2011 año
92.441
+0.788
0.86%
1 ene 2012 año
96.321
+3.88
4.2%
1 ene 2013 año
75.006
-21.314
-22.13%
Ranking de los países por los datos estadísticos actuales


Comentarios: