30
/es/
AIzaSyAYiBZKx7MnpbEhh9jyipgxe19OcubqV5w
April 1, 2024
117735
Czech Republic
CZE
true
2
1
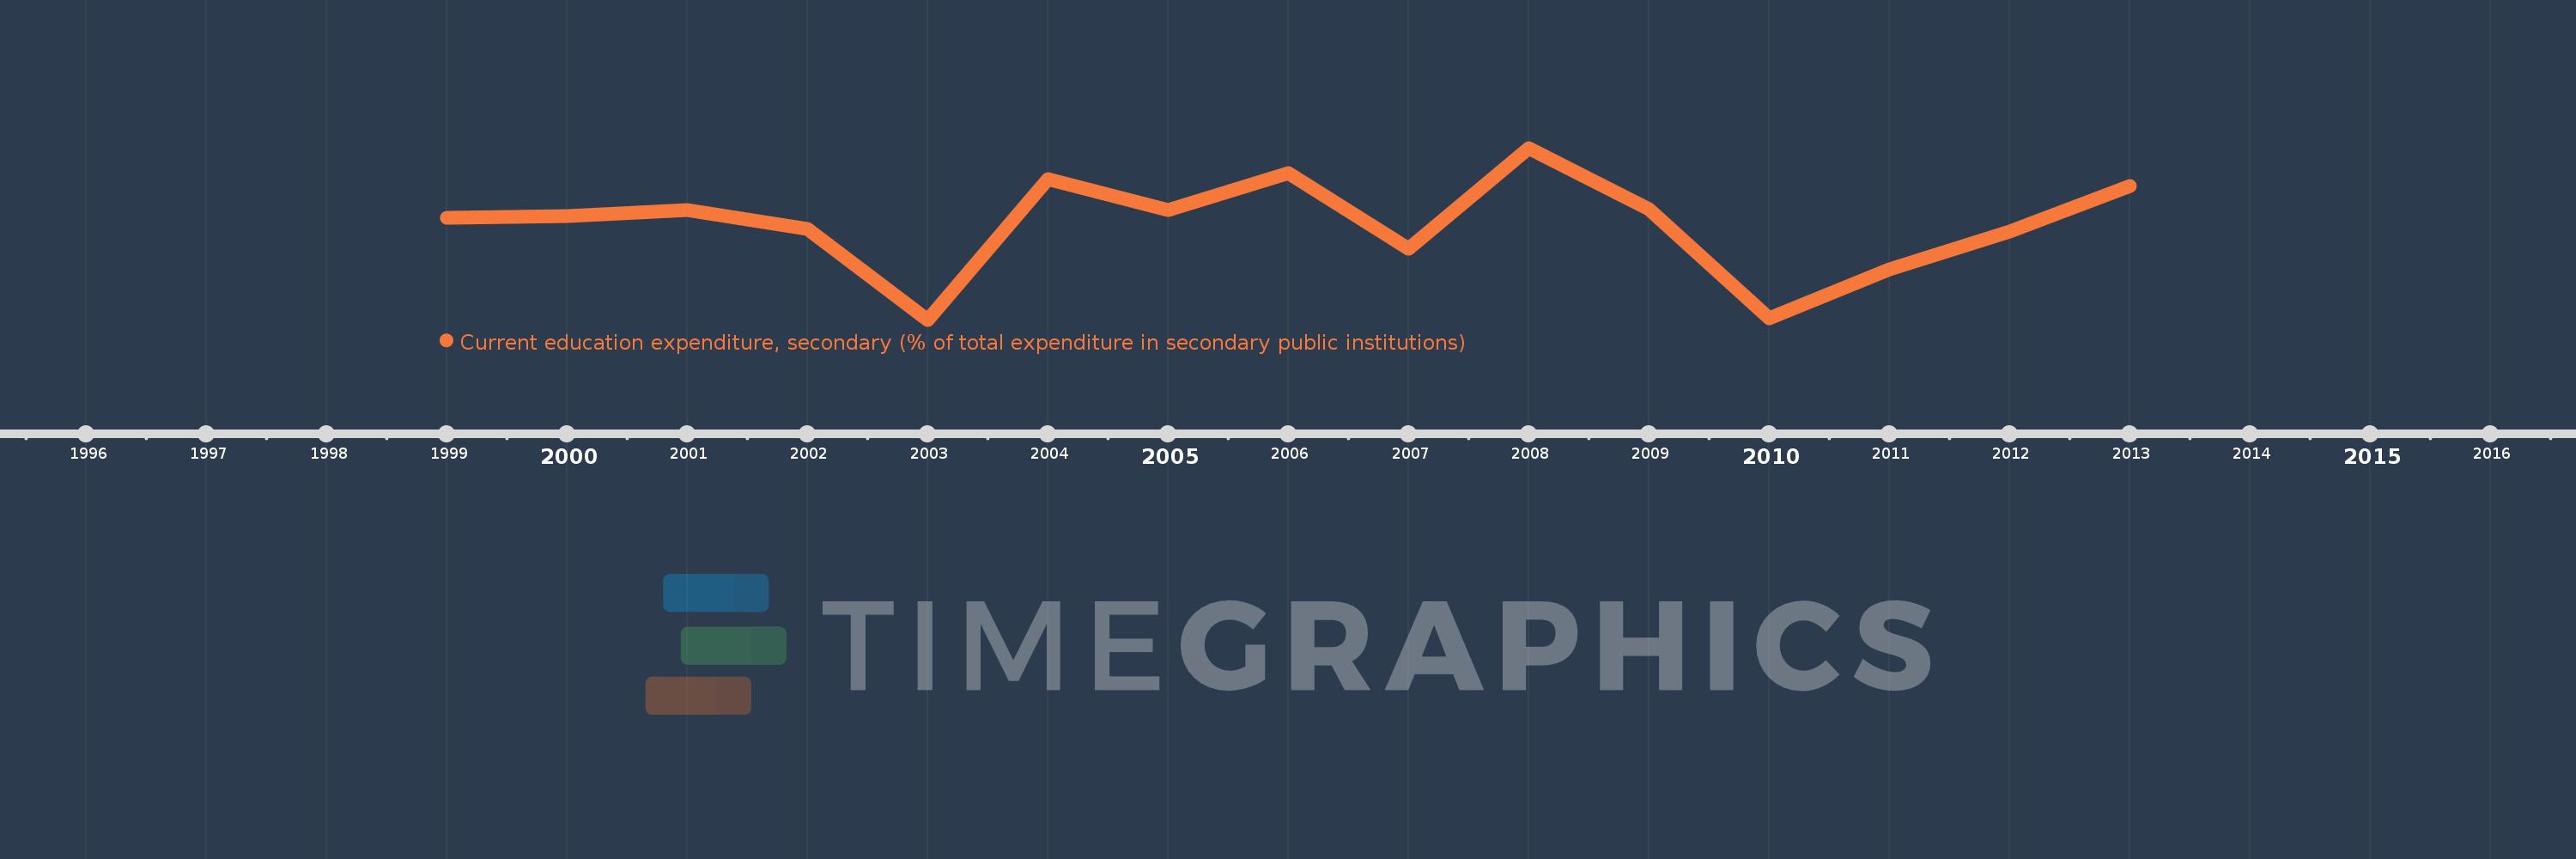
Current education expenditure, secondary (% of total expenditure in secondary public institutions)
2013,2012,2011,2010,2009,2008,2007,2006,2005,2004,2003,2002,2001,2000,1999
