30
/es/
AIzaSyAYiBZKx7MnpbEhh9jyipgxe19OcubqV5w
April 1, 2024
155794
Indonesia
IDN
true
2
1
Current education expenditure, secondary (% of total expenditure in secondary public institutions)
2015,2014,2013,2012,2011,2010,2009,2008
Download
Estadísticas Globales de la Biblioteca →Indonesia →

Current education expenditure, secondary (% of total expenditure in secondary public institutions)

Estas estadísticas en otros países:

AlbaniaAndorraAngolaAntigua and BarbudaArgentinaArmeniaArubaAustraliaAustriaAzerbaijanBahrainBangladeshBarbadosBelarusBelgiumBelizeBeninBhutanBoliviaBotswanaBrazilBritish Virgin IslandsBulgariaBurkina FasoBurundiCabo VerdeCambodiaCameroonCanadaCaribbean small statesCayman IslandsCentral African RepublicCentral Europe and the BalticsChadChileChinaColombiaComorosCongo, Dem. Rep.Costa RicaCote d'IvoireCubaCuracaoCyprusCzech RepublicDenmarkDjiboutiDominicaDominican RepublicEast Asia & PacificEast Asia & Pacific (IDA & IBRD countries)EcuadorEl SalvadorEritreaEstoniaEthiopiaEuro areaEurope & Central AsiaEuropean UnionFinlandFranceGambia, TheGermanyGhanaGreeceGrenadaGuatemalaGuineaGuinea-BissauGuyanaHeavily indebted poor countries (HIPC)High incomeHondurasHong Kong SAR, ChinaHungaryIcelandIDA blendIndiaIndonesiaIran, Islamic Rep.IrelandIsraelItalyJamaicaJapanJordanKazakhstanKorea, Rep.KuwaitKyrgyz RepublicLate-demographic dividendLatin America & Caribbean Latin America & Caribbean (excluding high income)Latin America & the Caribbean (IDA & IBRD countries)LatviaLebanonLesothoLiechtensteinLithuaniaLow incomeLuxembourgMacao SAR, ChinaMadagascarMalawiMalaysiaMaliMaltaMarshall IslandsMauritiusMexicoMoldovaMonacoMongoliaMoroccoMozambiqueNamibiaNetherlandsNicaraguaNigerNorth AmericaNorwayOECD membersOmanPakistanPanamaParaguayPeruPhilippinesPolandPortugalPost-demographic dividendPuerto RicoRomaniaRwandaSan MarinoSao Tome and PrincipeSenegalSerbiaSeychellesSierra LeoneSingaporeSlovak RepublicSloveniaSouth AfricaSpainSri LankaSt. Kitts and NevisSt. LuciaSt. Vincent and the GrenadinesSub-Saharan Africa Sub-Saharan Africa (excluding high income)Sub-Saharan Africa (IDA & IBRD countries)SwedenSwitzerlandSyrian Arab RepublicThailandTimor-LesteTogoTunisiaTurkeyTurks and Caicos IslandsUgandaUkraineUnited Arab EmiratesUnited KingdomUnited StatesUruguayVanuatuVenezuela, RBVietnamYemen, Rep.Zambia

línea de tiempo (timeline):

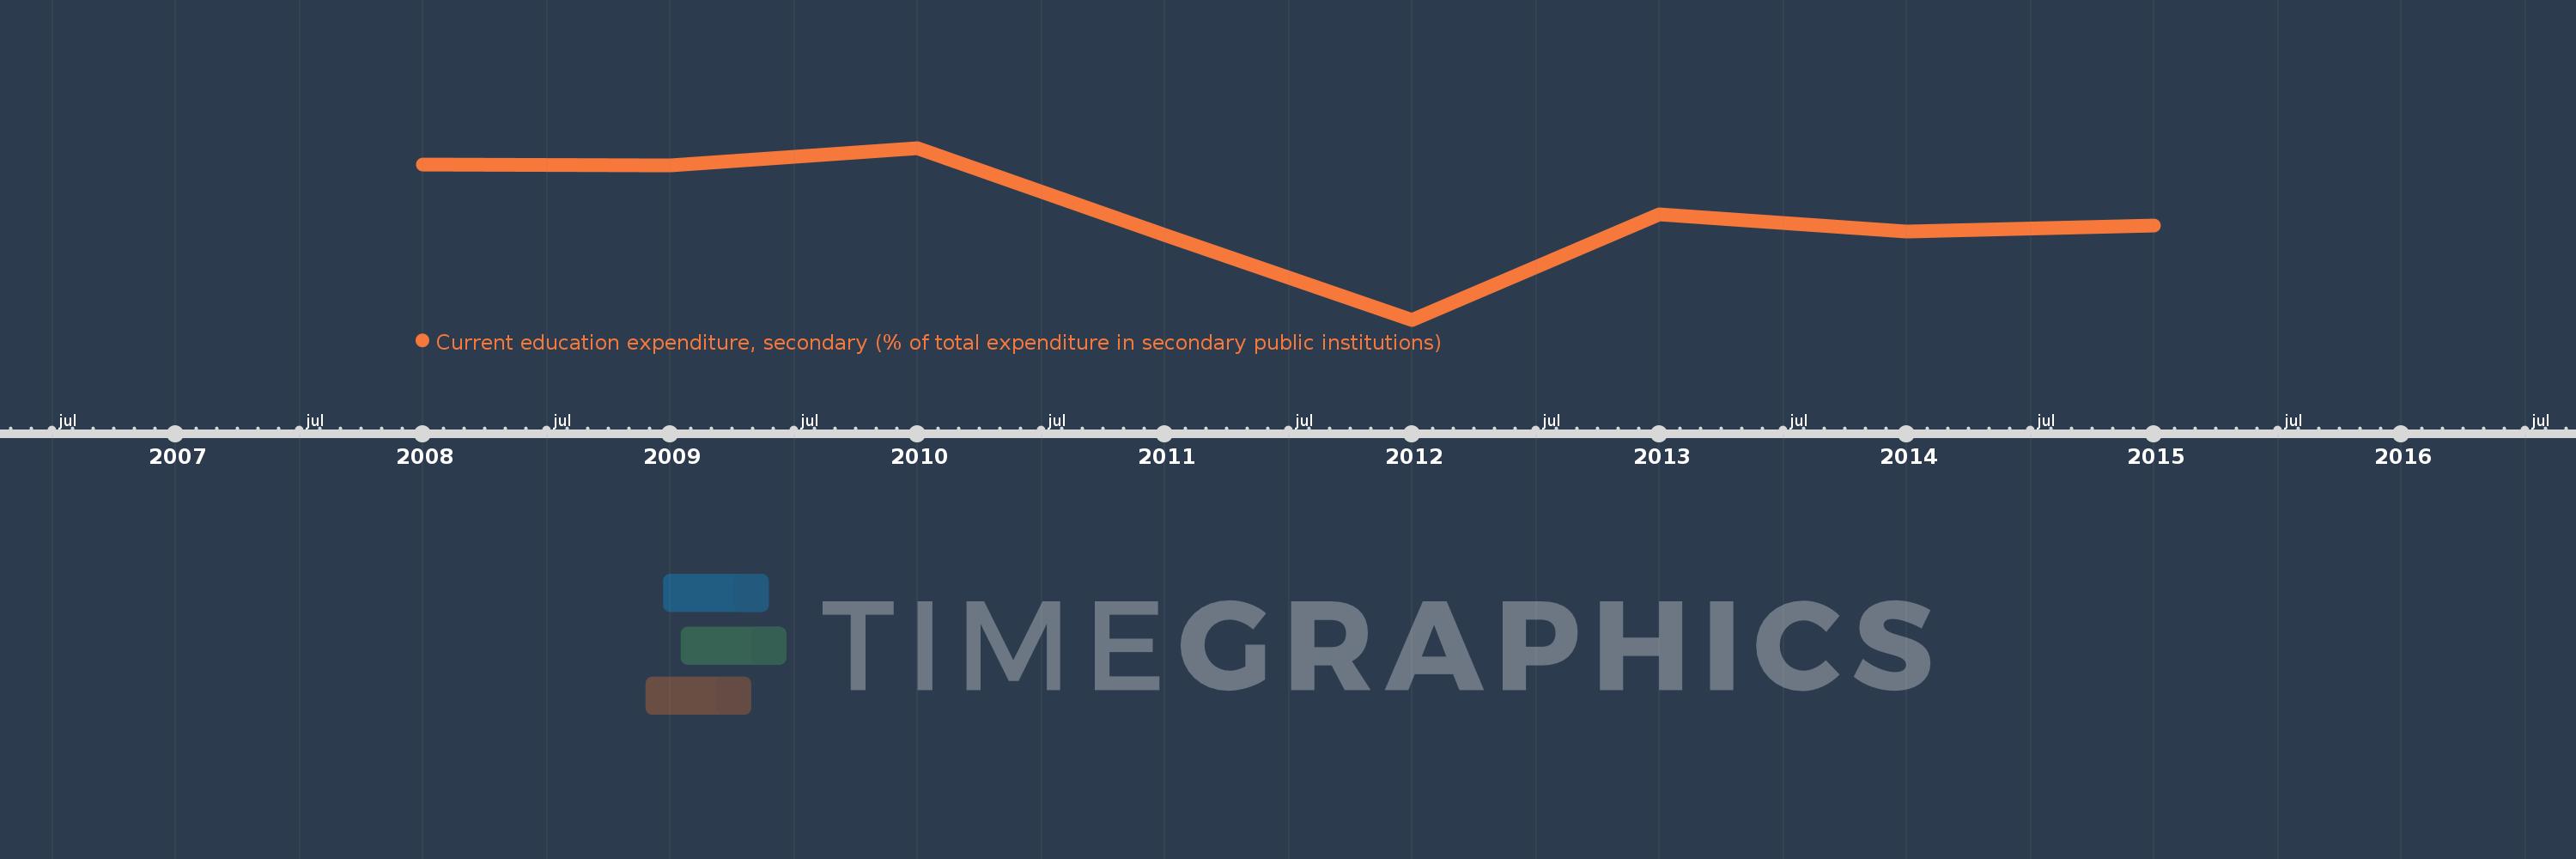
En esta escala de tiempo se presenta un gráfico de 2008 y 2015 de Indonesia. Los datos de 2007 están ausentes. El número de observaciones reales por fecha: 8.

Fuente (nombre):

Indicadores del desarrollo mundial

Fuente (organización):

United Nations Educational, Scientific, and Cultural Organization (UNESCO) Institute for Statistics.

Categorías:

Education

Se ha actualizado:

23 abr 2017 año

Los indicadores de los cambios de valor en los últimos años

En promedio:
92.576
Mínimo:
91.291
1 ene 2012 año
Máximo:
93.359
1 ene 2010 año
A la fecha de observación
Valor
Cambio absoluto
El cambio con respecto al valor anterior
1 ene 2008 año
93.161
+93.161
0.0%
1 ene 2009 año
93.145
-0.016
-0.02%
1 ene 2010 año
93.359
+0.213
0.23%
1 ene 2011 año
92.307
-1.052
-1.13%
1 ene 2012 año
91.291
-1.016
-1.1%
1 ene 2013 año
92.561
+1.27
1.39%
1 ene 2014 año
92.358
-0.203
-0.22%
1 ene 2015 año
92.422
+0.064
0.07%

Ranking de los países por los datos estadísticos actuales