29
/es/
es
AIzaSyAYiBZKx7MnpbEhh9jyipgxe19OcubqV5w
April 1, 2024
78695
Bangladesh
BGD
true
2
1
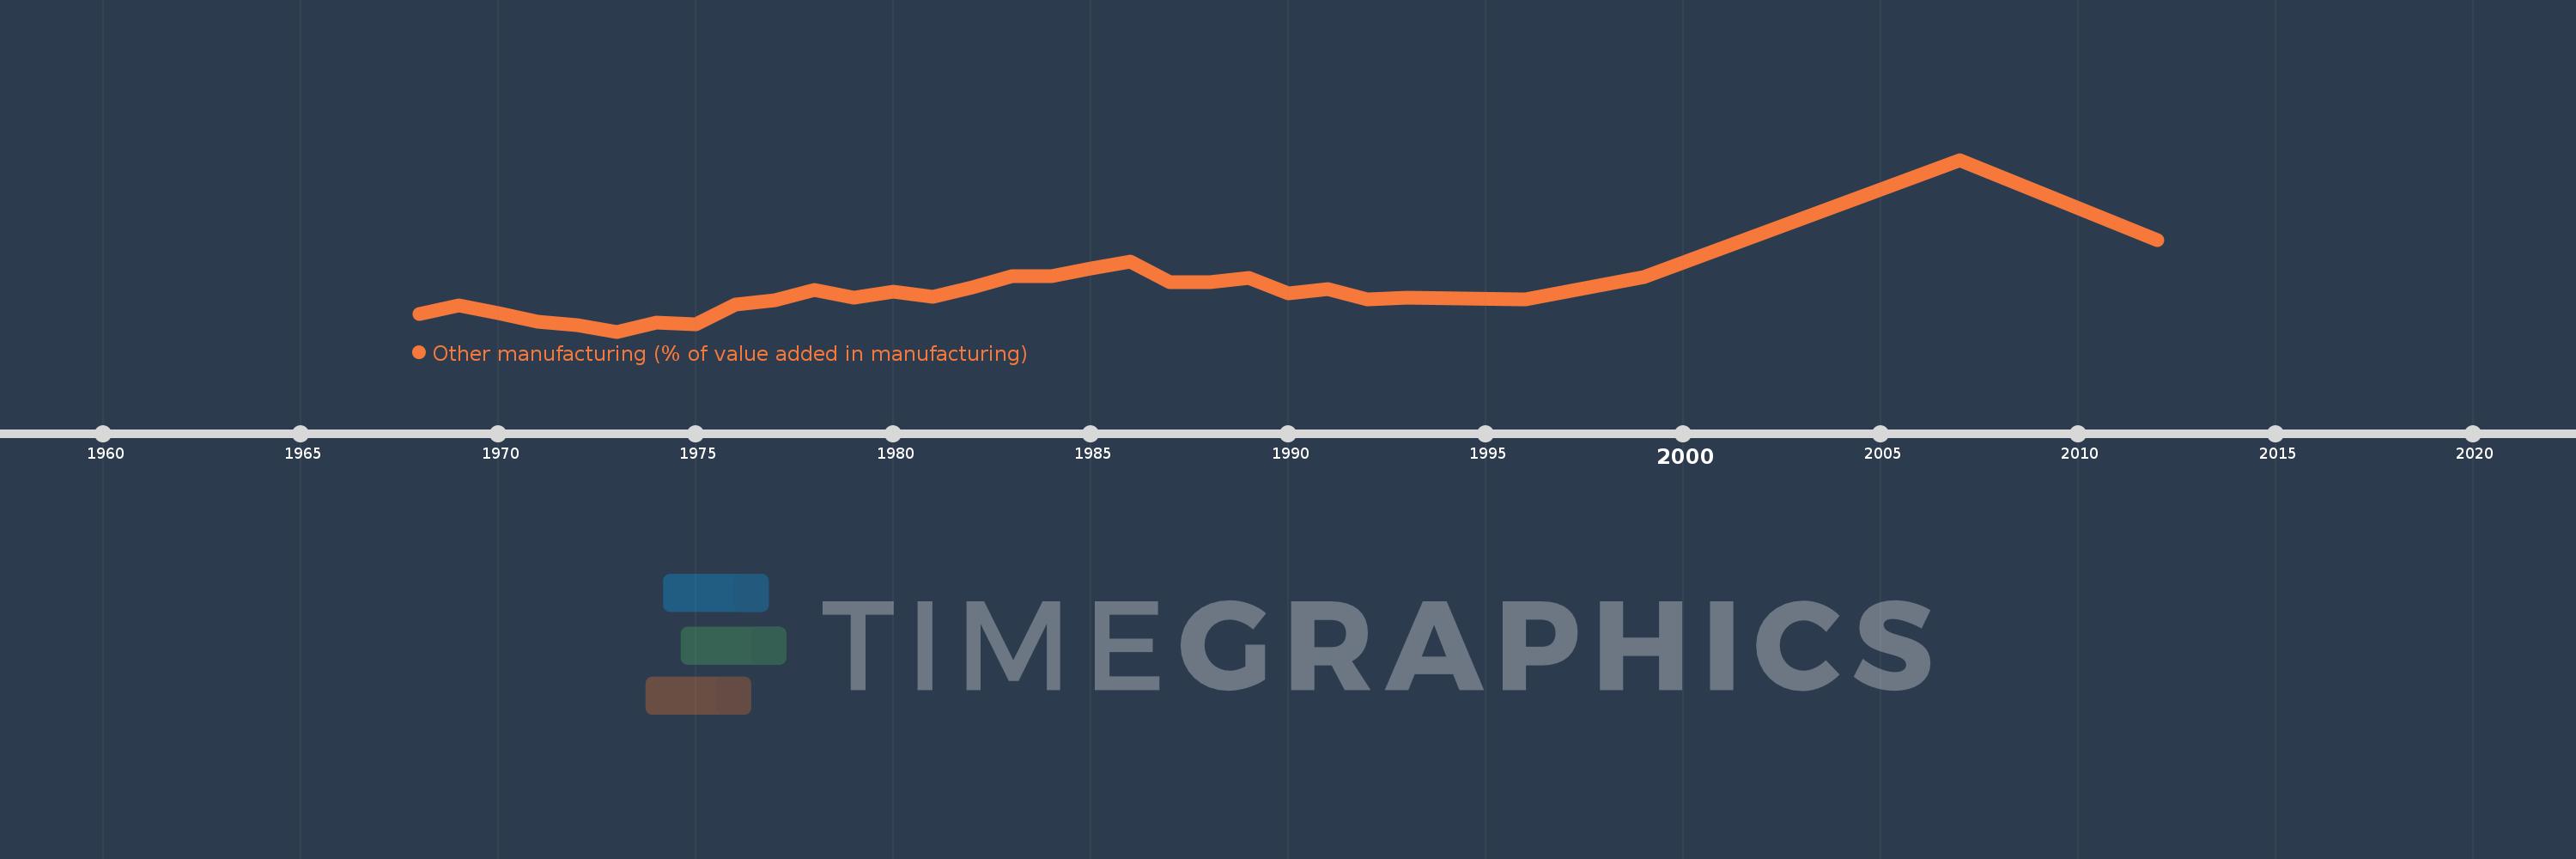
Other manufacturing (% of value added in manufacturing)
2012,2007,1999,1996,1993,1992,1991,1990,1989,1988,1987,1986,1985,1984,1983,1982,1981,1980,1979,1978,1977,1976,1975,1974,1973,1972,1971,1970,1969,1968
Estas estadísticas en otros países:
AlbaniaAlgeriaArgentinaAustraliaAustriaAzerbaijanBahamas, TheBahrainBangladeshBarbadosBelarusBelgiumBelizeBeninBoliviaBosnia and HerzegovinaBotswanaBrazilBulgariaBurkina FasoBurundiCambodiaCameroonCanadaCentral African RepublicChileChinaColombiaCongo, Rep.Costa RicaCote d'IvoireCroatiaCubaCyprusCzech RepublicDenmarkDominican RepublicEcuadorEgypt, Arab Rep.El SalvadorEritreaEstoniaEthiopiaFijiFinlandFranceGabonGambia, TheGeorgiaGermanyGhanaGreeceGuatemalaHondurasHong Kong SAR, ChinaHungaryIcelandIndiaIndonesiaIran, Islamic Rep.IraqIrelandIsraelItalyJamaicaJapanJordanKazakhstanKenyaKorea, Rep.KuwaitKyrgyz RepublicLao PDRLatviaLebanonLesothoLibyaLithuaniaLuxembourgMacao SAR, ChinaMacedonia, FYRMadagascarMalawiMalaysiaMaltaMauritiusMexicoMoldovaMongoliaMoroccoMozambiqueNamibiaNepalNetherlandsNew ZealandNicaraguaNigerNigeriaNorwayOmanPakistanPanamaPapua New GuineaParaguayPeruPhilippinesPolandPortugalPuerto RicoQatarRomaniaRussian FederationRwandaSaudi ArabiaSenegalSerbiaSierra LeoneSingaporeSlovak RepublicSloveniaSomaliaSouth AfricaSpainSri LankaSt. LuciaSudanSwazilandSwedenSwitzerlandSyrian Arab RepublicTanzaniaThailandTongaTrinidad and TobagoTunisiaTurkeyUgandaUkraineUnited Arab EmiratesUnited KingdomUnited StatesUruguayVenezuela, RBVietnamWest Bank and GazaYemen, Rep.Zambia línea de tiempo (timeline):
En esta escala de tiempo se presenta un gráfico de 1968 y 2012 de Bangladesh. Los datos de 1967 están ausentes. El número de observaciones reales por fecha: 30.
Fuente (nombre):
Indicadores del desarrollo mundial
Fuente (organización):
United Nations Industrial Development Organization, International Yearbook of Industrial Statistics.
Categorías:
Economy & Growth
Se ha actualizado:
23 abr 2017 año
Los indicadores de los cambios de valor en los últimos años
Mínimo:
8.562
1 ene 1973 año
Máximo:
46.351
1 ene 2007 año
A la fecha de observación
Valor
Cambio absoluto
El cambio con respecto al valor anterior
1 ene 1968 año
12.498
+12.498
0.0%
1 ene 1969 año
14.233
+1.735
13.88%
1 ene 1970 año
12.645
-1.587
-11.15%
1 ene 1971 año
10.765
-1.88
-14.87%
1 ene 1972 año
9.959
-0.806
-7.49%
1 ene 1973 año
8.562
-1.397
-14.03%
1 ene 1974 año
10.485
+1.923
22.45%
1 ene 1975 año
10.246
-0.238
-2.27%
1 ene 1976 año
14.475
+4.229
41.28%
1 ene 1977 año
15.528
+1.052
7.27%
1 ene 1978 año
17.695
+2.168
13.96%
1 ene 1979 año
16.024
-1.672
-9.45%
1 ene 1980 año
17.327
+1.304
8.14%
1 ene 1981 año
16.131
-1.196
-6.9%
1 ene 1982 año
18.273
+2.142
13.28%
1 ene 1983 año
20.711
+2.437
13.34%
1 ene 1984 año
20.796
+0.086
0.41%
1 ene 1985 año
22.422
+1.626
7.82%
1 ene 1986 año
24.051
+1.629
7.27%
1 ene 1987 año
19.4
-4.652
-19.34%
1 ene 1988 año
19.388
-0.012
-0.06%
1 ene 1989 año
20.294
+0.905
4.67%
1 ene 1990 año
17.02
-3.274
-16.13%
1 ene 1991 año
17.945
+0.925
5.43%
1 ene 1992 año
15.716
-2.229
-12.42%
1 ene 1993 año
16.074
+0.357
2.27%
1 ene 1996 año
15.563
-0.511
-3.18%
1 ene 1999 año
20.652
+5.089
32.7%
1 ene 2007 año
46.351
+25.699
124.44%
1 ene 2012 año
28.603
-17.748
-38.29%
Ranking de los países por los datos estadísticos actuales


Comentarios: