29
/es/
es
AIzaSyAYiBZKx7MnpbEhh9jyipgxe19OcubqV5w
April 1, 2024
112701
Costa Rica
CRI
true
2
1
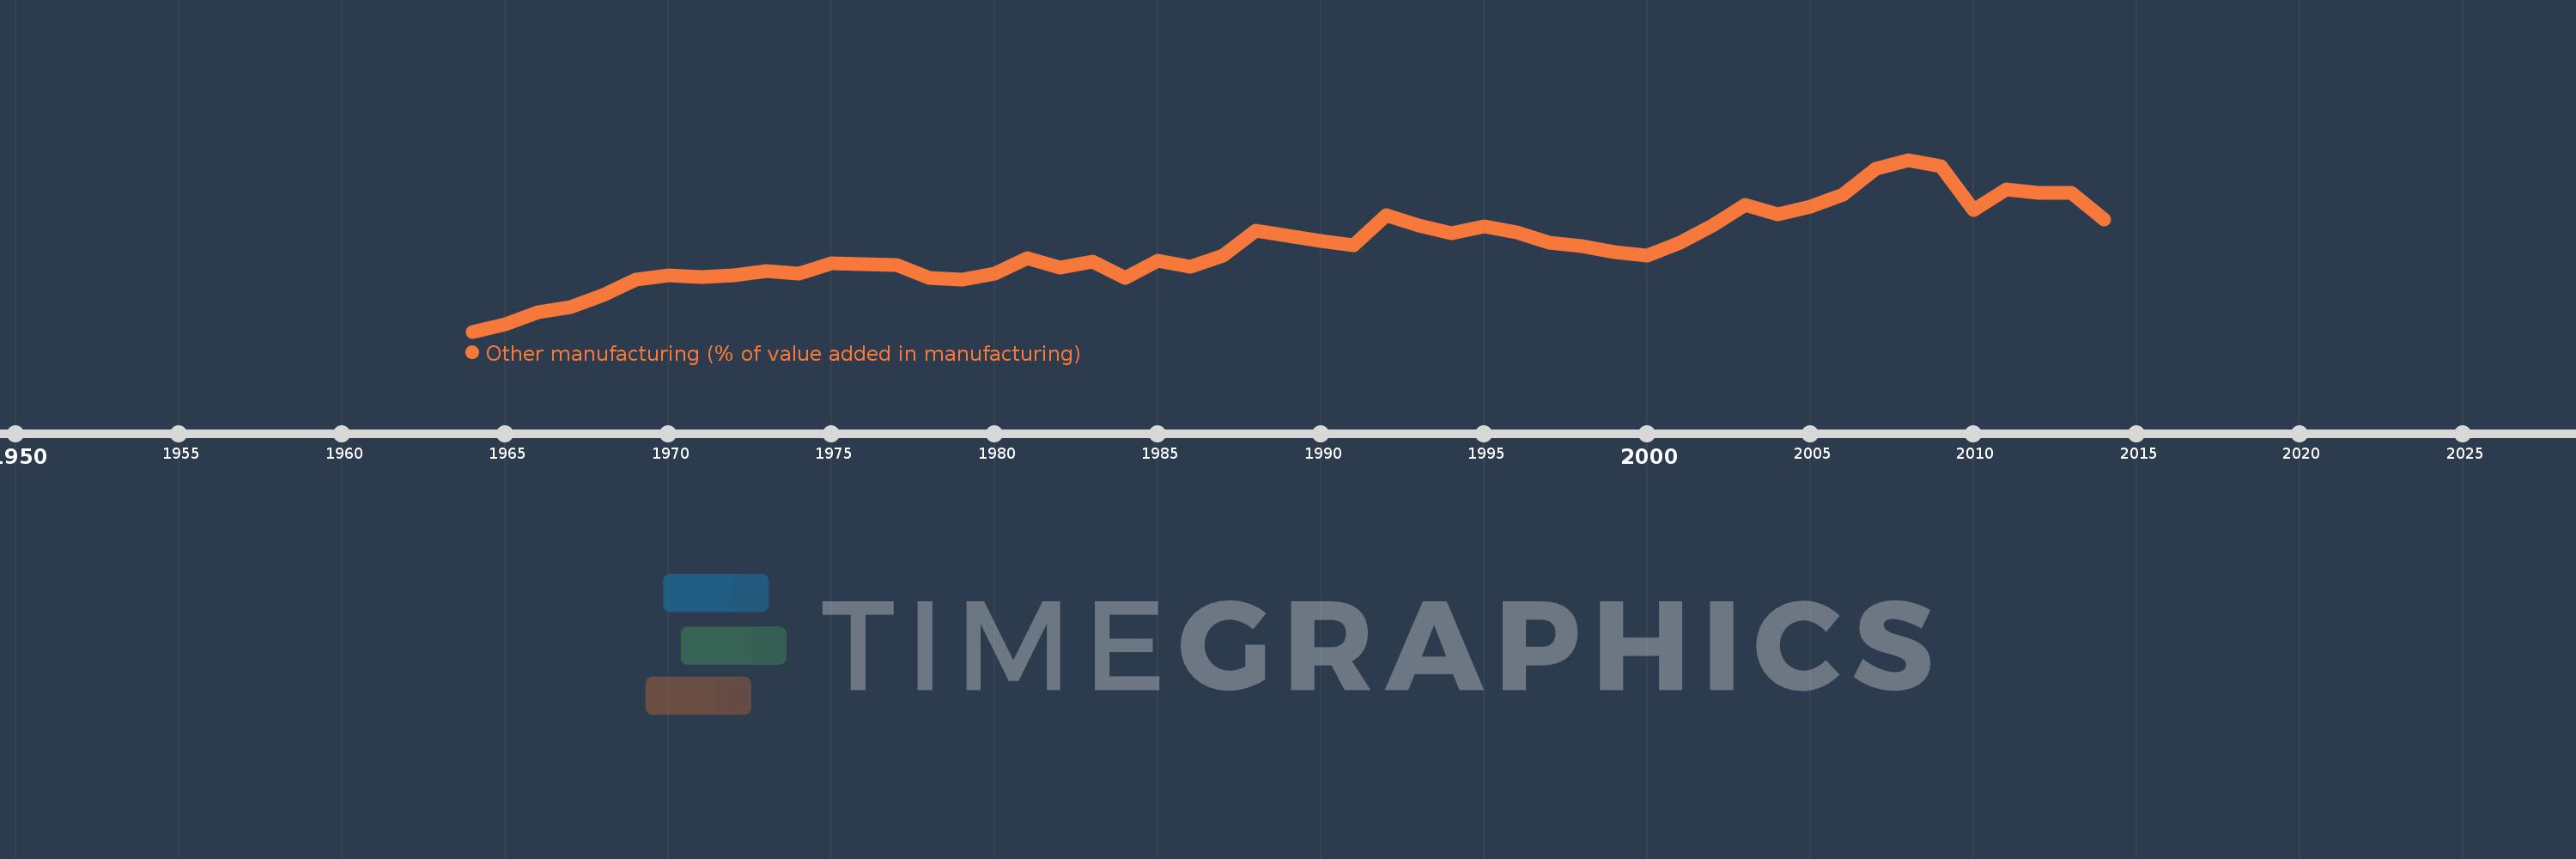
Other manufacturing (% of value added in manufacturing)
2014,2013,2012,2011,2010,2009,2008,2007,2006,2005,2004,2003,2002,2001,2000,1999,1998,1997,1996,1995,1994,1993,1992,1991,1990,1989,1988,1987,1986,1985,1984,1983,1982,1981,1980,1979,1978,1977,1976,1975,1974,1973,1972,1971,1970,1969,1968,1967,1966,1965,1964
Estas estadísticas en otros países:
AlbaniaAlgeriaArgentinaAustraliaAustriaAzerbaijanBahamas, TheBahrainBangladeshBarbadosBelarusBelgiumBelizeBeninBoliviaBosnia and HerzegovinaBotswanaBrazilBulgariaBurkina FasoBurundiCambodiaCameroonCanadaCentral African RepublicChileChinaColombiaCongo, Rep.Costa RicaCote d'IvoireCroatiaCubaCyprusCzech RepublicDenmarkDominican RepublicEcuadorEgypt, Arab Rep.El SalvadorEritreaEstoniaEthiopiaFijiFinlandFranceGabonGambia, TheGeorgiaGermanyGhanaGreeceGuatemalaHondurasHong Kong SAR, ChinaHungaryIcelandIndiaIndonesiaIran, Islamic Rep.IraqIrelandIsraelItalyJamaicaJapanJordanKazakhstanKenyaKorea, Rep.KuwaitKyrgyz RepublicLao PDRLatviaLebanonLesothoLibyaLithuaniaLuxembourgMacao SAR, ChinaMacedonia, FYRMadagascarMalawiMalaysiaMaltaMauritiusMexicoMoldovaMongoliaMoroccoMozambiqueNamibiaNepalNetherlandsNew ZealandNicaraguaNigerNigeriaNorwayOmanPakistanPanamaPapua New GuineaParaguayPeruPhilippinesPolandPortugalPuerto RicoQatarRomaniaRussian FederationRwandaSaudi ArabiaSenegalSerbiaSierra LeoneSingaporeSlovak RepublicSloveniaSomaliaSouth AfricaSpainSri LankaSt. LuciaSudanSwazilandSwedenSwitzerlandSyrian Arab RepublicTanzaniaThailandTongaTrinidad and TobagoTunisiaTurkeyUgandaUkraineUnited Arab EmiratesUnited KingdomUnited StatesUruguayVenezuela, RBVietnamWest Bank and GazaYemen, Rep.Zambia línea de tiempo (timeline):
En esta escala de tiempo se presenta un gráfico de 1964 y 2014 de Costa Rica. Los datos de 1963 están ausentes. El número de observaciones reales por fecha: 51.
Fuente (nombre):
Indicadores del desarrollo mundial
Fuente (organización):
United Nations Industrial Development Organization, International Yearbook of Industrial Statistics.
Categorías:
Economy & Growth
Se ha actualizado:
23 abr 2017 año
Los indicadores de los cambios de valor en los últimos años
Mínimo:
22.534
1 ene 1964 año
Máximo:
43.552
1 ene 2008 año
A la fecha de observación
Valor
Cambio absoluto
El cambio con respecto al valor anterior
1 ene 1964 año
22.534
+22.534
0.0%
1 ene 1965 año
23.397
+0.862
3.83%
1 ene 1966 año
24.951
+1.554
6.64%
1 ene 1967 año
25.559
+0.609
2.44%
1 ene 1968 año
26.957
+1.398
5.47%
1 ene 1969 año
28.852
+1.896
7.03%
1 ene 1970 año
29.422
+0.569
1.97%
1 ene 1971 año
29.202
-0.22
-0.75%
1 ene 1972 año
29.386
+0.184
0.63%
1 ene 1973 año
29.973
+0.588
2.0%
1 ene 1974 año
29.644
-0.329
-1.1%
1 ene 1975 año
30.911
+1.267
4.27%
1 ene 1976 año
30.788
-0.123
-0.4%
1 ene 1977 año
30.7
-0.088
-0.29%
1 ene 1978 año
29.064
-1.636
-5.33%
1 ene 1979 año
28.877
-0.187
-0.64%
1 ene 1980 año
29.643
+0.766
2.65%
1 ene 1981 año
31.497
+1.854
6.25%
1 ene 1982 año
30.406
-1.09
-3.46%
1 ene 1983 año
31.11
+0.703
2.31%
1 ene 1984 año
29.101
-2.009
-6.46%
1 ene 1985 año
31.169
+2.068
7.11%
1 ene 1986 año
30.464
-0.705
-2.26%
1 ene 1987 año
31.84
+1.376
4.52%
1 ene 1988 año
34.911
+3.071
9.65%
1 ene 1989 año
34.248
-0.663
-1.9%
1 ene 1990 año
33.64
-0.608
-1.78%
1 ene 1991 año
33.13
-0.51
-1.52%
1 ene 1992 año
36.753
+3.623
10.94%
1 ene 1993 año
35.482
-1.271
-3.46%
1 ene 1994 año
34.524
-0.959
-2.7%
1 ene 1995 año
35.43
+0.906
2.63%
1 ene 1996 año
34.71
-0.72
-2.03%
1 ene 1997 año
33.419
-1.291
-3.72%
1 ene 1998 año
32.951
-0.468
-1.4%
1 ene 1999 año
32.232
-0.719
-2.18%
1 ene 2000 año
31.821
-0.411
-1.27%
1 ene 2001 año
33.444
+1.623
5.1%
1 ene 2002 año
35.509
+2.064
6.17%
1 ene 2003 año
38.067
+2.558
7.2%
1 ene 2004 año
36.882
-1.185
-3.11%
1 ene 2005 año
37.815
+0.933
2.53%
1 ene 2006 año
39.318
+1.503
3.97%
1 ene 2007 año
42.457
+3.139
7.98%
1 ene 2008 año
43.552
+1.095
2.58%
1 ene 2009 año
42.756
-0.796
-1.83%
1 ene 2010 año
37.445
-5.311
-12.42%
1 ene 2011 año
39.92
+2.474
6.61%
1 ene 2012 año
39.517
-0.403
-1.01%
1 ene 2013 año
39.526
+0.009
0.02%
1 ene 2014 año
36.256
-3.27
-8.27%
Ranking de los países por los datos estadísticos actuales


Comentarios: