29
/es/
es
AIzaSyAYiBZKx7MnpbEhh9jyipgxe19OcubqV5w
April 1, 2024
281425
Venezuela, RB
VEN
true
2
1
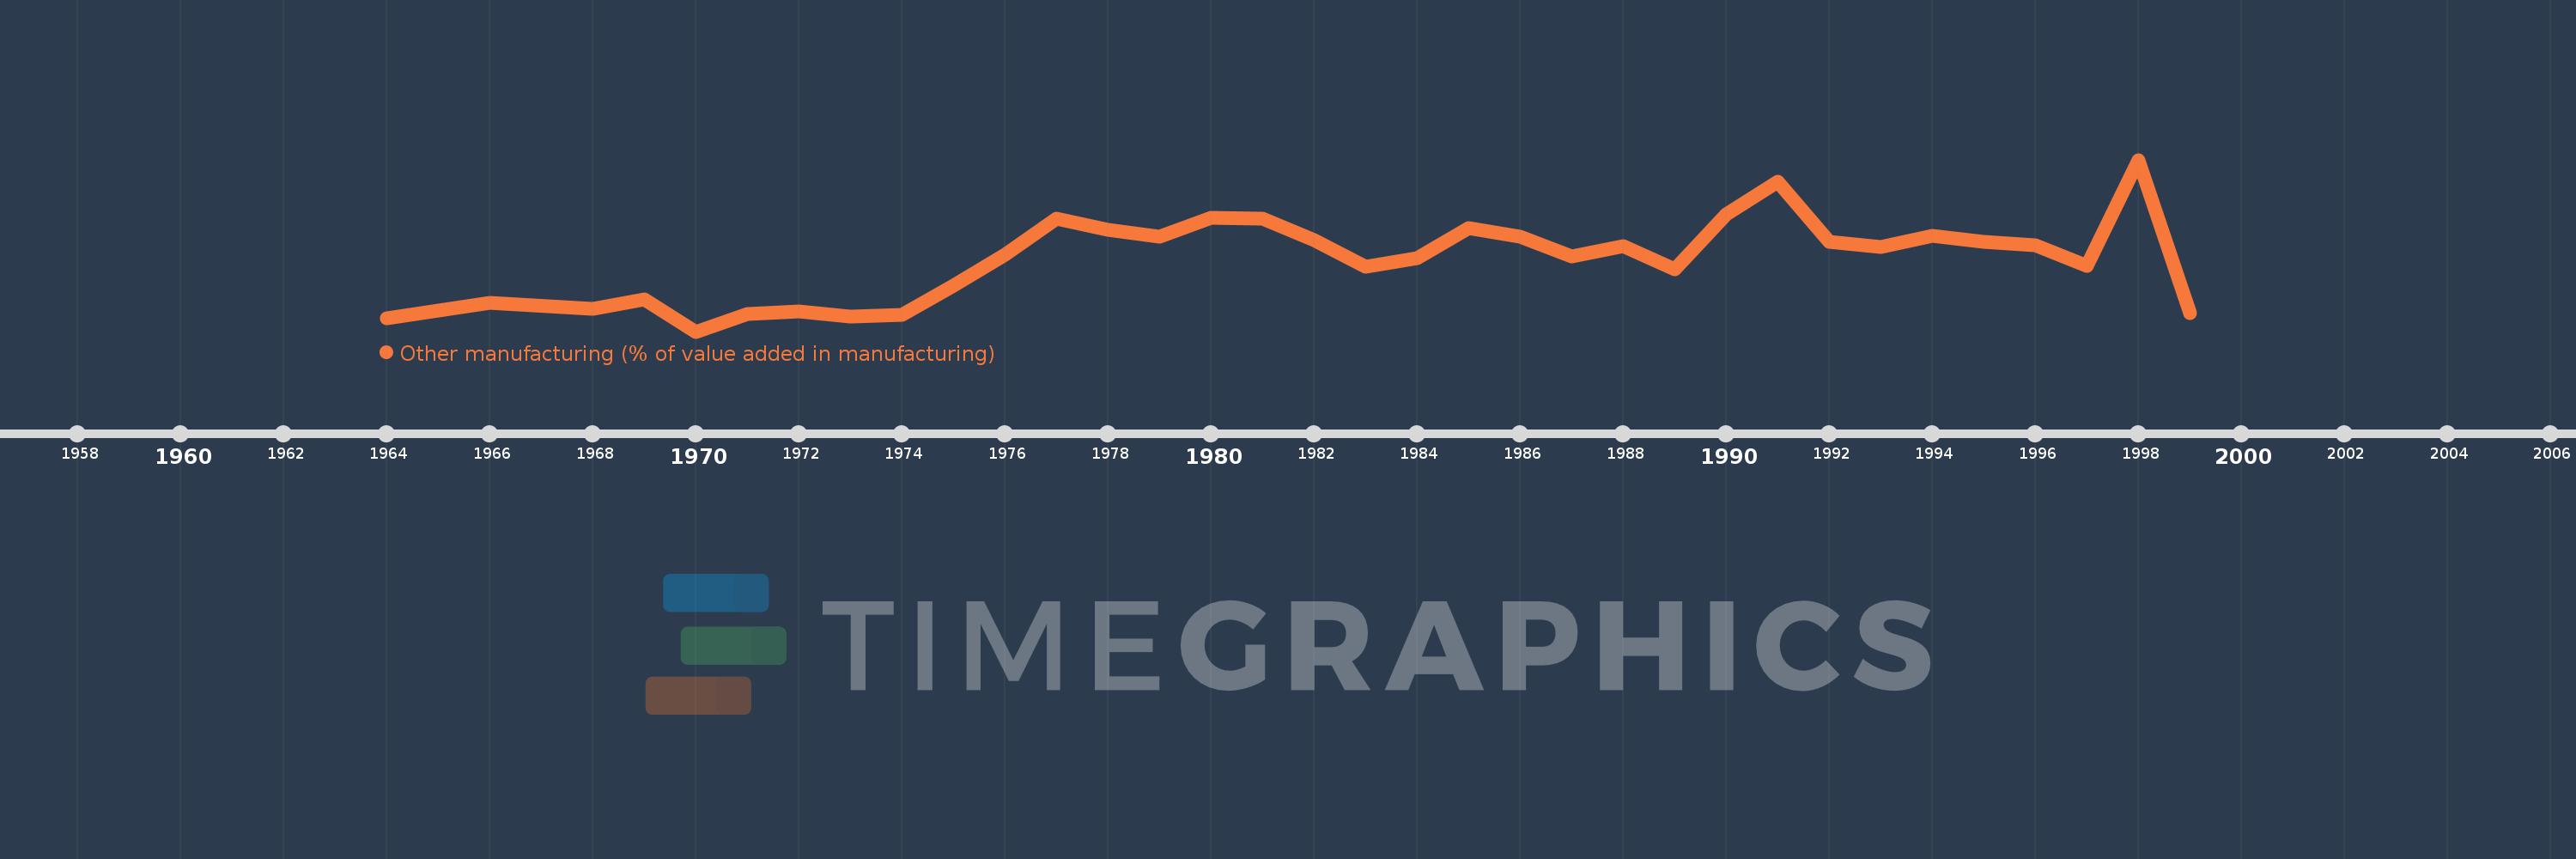
Other manufacturing (% of value added in manufacturing)
1999,1998,1997,1996,1995,1994,1993,1992,1991,1990,1989,1988,1987,1986,1985,1984,1983,1982,1981,1980,1979,1978,1977,1976,1975,1974,1973,1972,1971,1970,1969,1968,1966,1964
Estas estadísticas en otros países:
AlbaniaAlgeriaArgentinaAustraliaAustriaAzerbaijanBahamas, TheBahrainBangladeshBarbadosBelarusBelgiumBelizeBeninBoliviaBosnia and HerzegovinaBotswanaBrazilBulgariaBurkina FasoBurundiCambodiaCameroonCanadaCentral African RepublicChileChinaColombiaCongo, Rep.Costa RicaCote d'IvoireCroatiaCubaCyprusCzech RepublicDenmarkDominican RepublicEcuadorEgypt, Arab Rep.El SalvadorEritreaEstoniaEthiopiaFijiFinlandFranceGabonGambia, TheGeorgiaGermanyGhanaGreeceGuatemalaHondurasHong Kong SAR, ChinaHungaryIcelandIndiaIndonesiaIran, Islamic Rep.IraqIrelandIsraelItalyJamaicaJapanJordanKazakhstanKenyaKorea, Rep.KuwaitKyrgyz RepublicLao PDRLatviaLebanonLesothoLibyaLithuaniaLuxembourgMacao SAR, ChinaMacedonia, FYRMadagascarMalawiMalaysiaMaltaMauritiusMexicoMoldovaMongoliaMoroccoMozambiqueNamibiaNepalNetherlandsNew ZealandNicaraguaNigerNigeriaNorwayOmanPakistanPanamaPapua New GuineaParaguayPeruPhilippinesPolandPortugalPuerto RicoQatarRomaniaRussian FederationRwandaSaudi ArabiaSenegalSerbiaSierra LeoneSingaporeSlovak RepublicSloveniaSomaliaSouth AfricaSpainSri LankaSt. LuciaSudanSwazilandSwedenSwitzerlandSyrian Arab RepublicTanzaniaThailandTongaTrinidad and TobagoTunisiaTurkeyUgandaUkraineUnited Arab EmiratesUnited KingdomUnited StatesUruguayVenezuela, RBVietnamWest Bank and GazaYemen, Rep.Zambia línea de tiempo (timeline):
En esta escala de tiempo se presenta un gráfico de 1964 y 1999 de Venezuela, RB. Los datos de 1963 están ausentes. El número de observaciones reales por fecha: 34.
Fuente (nombre):
Indicadores del desarrollo mundial
Fuente (organización):
United Nations Industrial Development Organization, International Yearbook of Industrial Statistics.
Categorías:
Economy & Growth
Se ha actualizado:
23 abr 2017 año
Los indicadores de los cambios de valor en los últimos años
Mínimo:
37.863
1 ene 1970 año
Máximo:
70.287
1 ene 1998 año
A la fecha de observación
Valor
Cambio absoluto
El cambio con respecto al valor anterior
1 ene 1964 año
40.334
+40.334
0.0%
1 ene 1966 año
43.232
+2.898
7.19%
1 ene 1968 año
42.202
-1.03
-2.38%
1 ene 1969 año
43.891
+1.688
4.0%
1 ene 1970 año
37.863
-6.027
-13.73%
1 ene 1971 año
41.245
+3.382
8.93%
1 ene 1972 año
41.621
+0.376
0.91%
1 ene 1973 año
40.763
-0.859
-2.06%
1 ene 1974 año
41.061
+0.298
0.73%
1 ene 1975 año
46.56
+5.5
13.39%
1 ene 1976 año
52.425
+5.865
12.6%
1 ene 1977 año
59.207
+6.782
12.94%
1 ene 1978 año
57.101
-2.106
-3.56%
1 ene 1979 año
55.702
-1.4
-2.45%
1 ene 1980 año
59.368
+3.666
6.58%
1 ene 1981 año
59.254
-0.113
-0.19%
1 ene 1982 año
55.087
-4.167
-7.03%
1 ene 1983 año
50.181
-4.906
-8.91%
1 ene 1984 año
51.773
+1.592
3.17%
1 ene 1985 año
57.404
+5.632
10.88%
1 ene 1986 año
55.764
-1.641
-2.86%
1 ene 1987 año
52.045
-3.719
-6.67%
1 ene 1988 año
54.045
+2.0
3.84%
1 ene 1989 año
49.674
-4.371
-8.09%
1 ene 1990 año
59.968
+10.294
20.72%
1 ene 1991 año
66.082
+6.115
10.2%
1 ene 1992 año
54.765
-11.318
-17.13%
1 ene 1993 año
53.874
-0.89
-1.63%
1 ene 1994 año
55.875
+2.0
3.71%
1 ene 1995 año
54.752
-1.123
-2.01%
1 ene 1996 año
54.218
-0.534
-0.98%
1 ene 1997 año
50.221
-3.996
-7.37%
1 ene 1998 año
70.287
+20.066
39.95%
1 ene 1999 año
41.28
-29.008
-41.27%
Ranking de los países por los datos estadísticos actuales


Comentarios: