29
/fr/
fr
AIzaSyAYiBZKx7MnpbEhh9jyipgxe19OcubqV5w
April 1, 2024
112701
Costa Rica
CRI
true
2
1
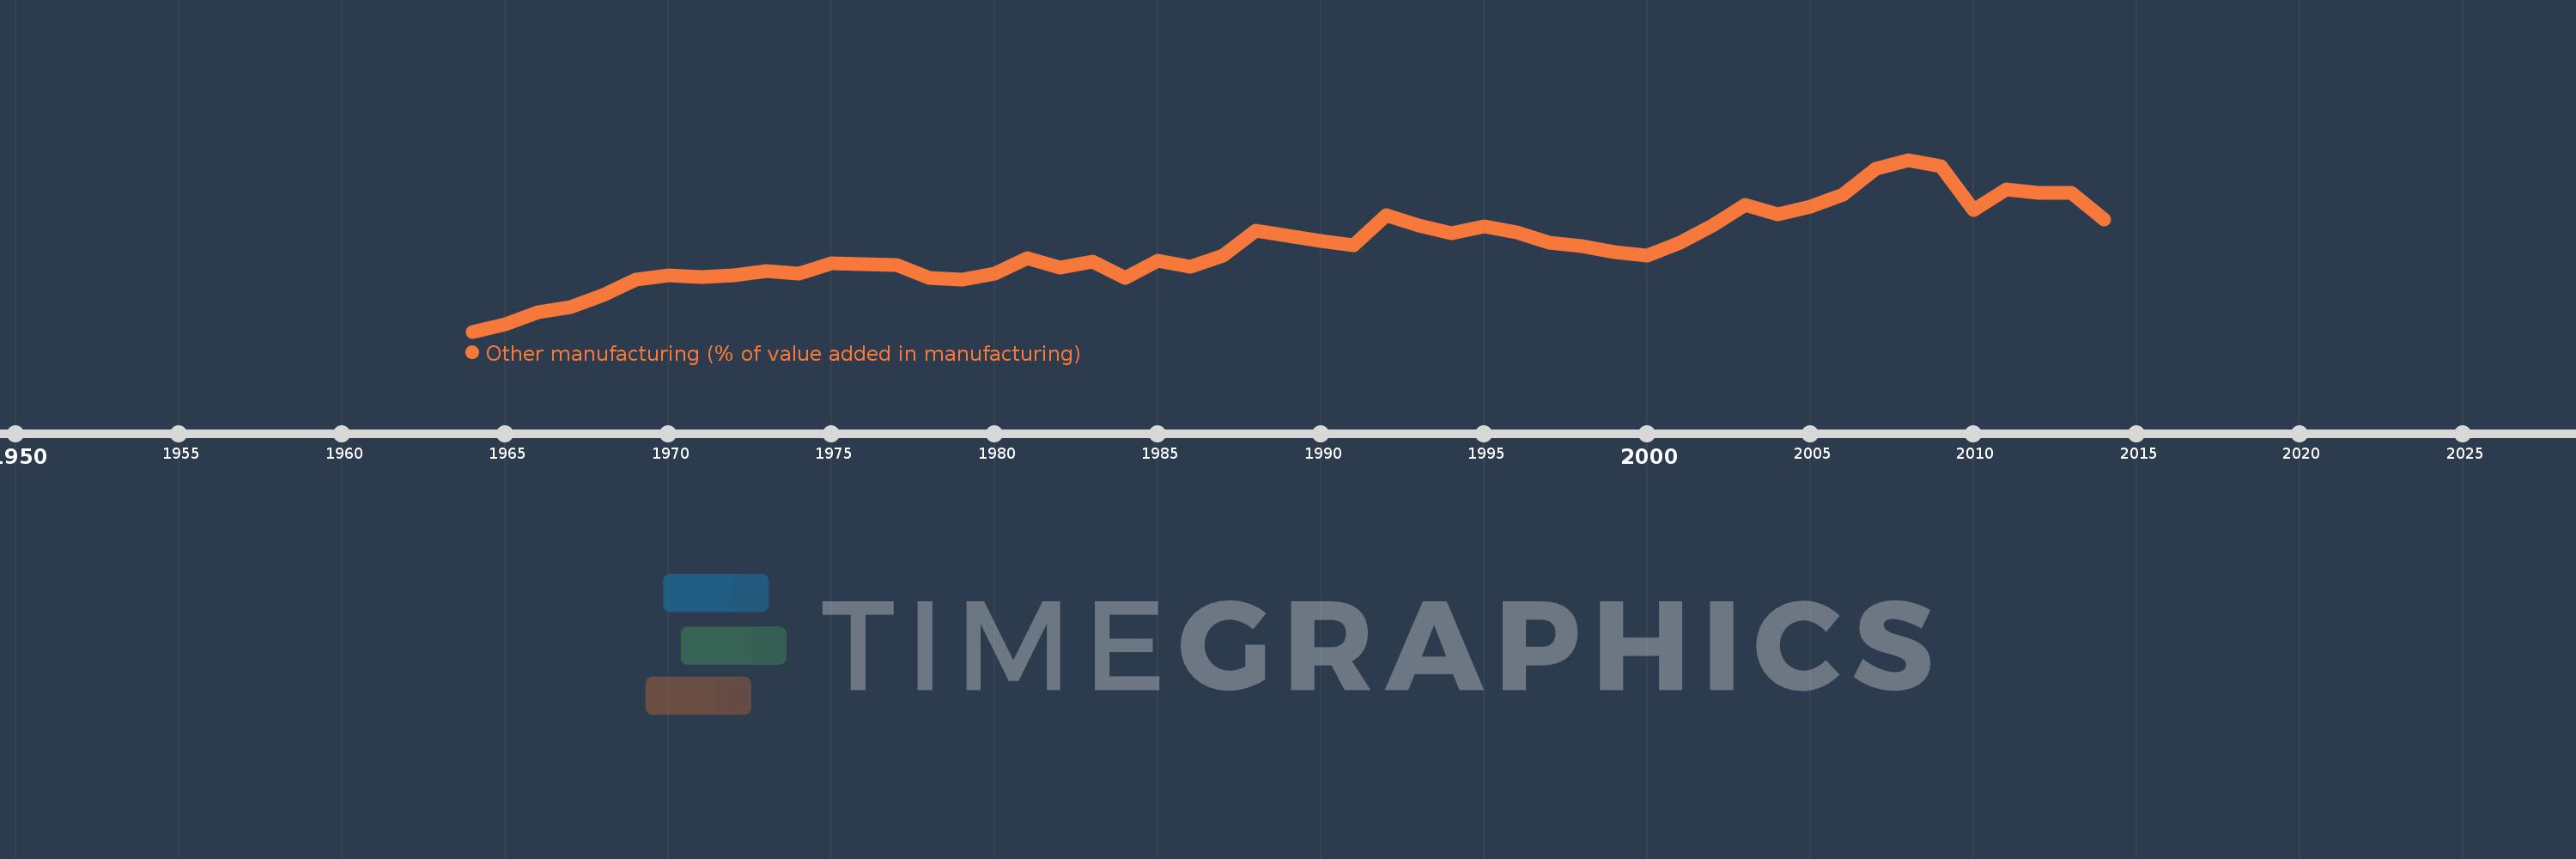
Other manufacturing (% of value added in manufacturing)
2014,2013,2012,2011,2010,2009,2008,2007,2006,2005,2004,2003,2002,2001,2000,1999,1998,1997,1996,1995,1994,1993,1992,1991,1990,1989,1988,1987,1986,1985,1984,1983,1982,1981,1980,1979,1978,1977,1976,1975,1974,1973,1972,1971,1970,1969,1968,1967,1966,1965,1964
Cette statistique dans les autres pays:
AlbaniaAlgeriaArgentinaAustraliaAustriaAzerbaijanBahamas, TheBahrainBangladeshBarbadosBelarusBelgiumBelizeBeninBoliviaBosnia and HerzegovinaBotswanaBrazilBulgariaBurkina FasoBurundiCambodiaCameroonCanadaCentral African RepublicChileChinaColombiaCongo, Rep.Costa RicaCote d'IvoireCroatiaCubaCyprusCzech RepublicDenmarkDominican RepublicEcuadorEgypt, Arab Rep.El SalvadorEritreaEstoniaEthiopiaFijiFinlandFranceGabonGambia, TheGeorgiaGermanyGhanaGreeceGuatemalaHondurasHong Kong SAR, ChinaHungaryIcelandIndiaIndonesiaIran, Islamic Rep.IraqIrelandIsraelItalyJamaicaJapanJordanKazakhstanKenyaKorea, Rep.KuwaitKyrgyz RepublicLao PDRLatviaLebanonLesothoLibyaLithuaniaLuxembourgMacao SAR, ChinaMacedonia, FYRMadagascarMalawiMalaysiaMaltaMauritiusMexicoMoldovaMongoliaMoroccoMozambiqueNamibiaNepalNetherlandsNew ZealandNicaraguaNigerNigeriaNorwayOmanPakistanPanamaPapua New GuineaParaguayPeruPhilippinesPolandPortugalPuerto RicoQatarRomaniaRussian FederationRwandaSaudi ArabiaSenegalSerbiaSierra LeoneSingaporeSlovak RepublicSloveniaSomaliaSouth AfricaSpainSri LankaSt. LuciaSudanSwazilandSwedenSwitzerlandSyrian Arab RepublicTanzaniaThailandTongaTrinidad and TobagoTunisiaTurkeyUgandaUkraineUnited Arab EmiratesUnited KingdomUnited StatesUruguayVenezuela, RBVietnamWest Bank and GazaYemen, Rep.Zambia La ligne de temps
Cette échelle de temps montre un graphique de 1964 année à 2014 année Costa Rica. Les données jusqu'à 1963 année ne sont pas présentés. Quantité d'observations actuelles selon dates: 51.
Source (désignation):
Les indicateurs du développement mondiale
Source (organisation):
United Nations Industrial Development Organization, International Yearbook of Industrial Statistics.
Catégories:
Economy & Growth
Dernière mise à jour
23 avr. 2017
Les indicateurs de changement de valeurs selon les années
Minimum:
22.534
1 janv. 1964
Maximum:
43.552
1 janv. 2008
Pour la date d''observation
Valeur
Changement absolu
Le changement par rapport à la valeur précédente
1 janv. 1964
22.534
+22.534
0.0%
1 janv. 1965
23.397
+0.862
3.83%
1 janv. 1966
24.951
+1.554
6.64%
1 janv. 1967
25.559
+0.609
2.44%
1 janv. 1968
26.957
+1.398
5.47%
1 janv. 1969
28.852
+1.896
7.03%
1 janv. 1970
29.422
+0.569
1.97%
1 janv. 1971
29.202
-0.22
-0.75%
1 janv. 1972
29.386
+0.184
0.63%
1 janv. 1973
29.973
+0.588
2.0%
1 janv. 1974
29.644
-0.329
-1.1%
1 janv. 1975
30.911
+1.267
4.27%
1 janv. 1976
30.788
-0.123
-0.4%
1 janv. 1977
30.7
-0.088
-0.29%
1 janv. 1978
29.064
-1.636
-5.33%
1 janv. 1979
28.877
-0.187
-0.64%
1 janv. 1980
29.643
+0.766
2.65%
1 janv. 1981
31.497
+1.854
6.25%
1 janv. 1982
30.406
-1.09
-3.46%
1 janv. 1983
31.11
+0.703
2.31%
1 janv. 1984
29.101
-2.009
-6.46%
1 janv. 1985
31.169
+2.068
7.11%
1 janv. 1986
30.464
-0.705
-2.26%
1 janv. 1987
31.84
+1.376
4.52%
1 janv. 1988
34.911
+3.071
9.65%
1 janv. 1989
34.248
-0.663
-1.9%
1 janv. 1990
33.64
-0.608
-1.78%
1 janv. 1991
33.13
-0.51
-1.52%
1 janv. 1992
36.753
+3.623
10.94%
1 janv. 1993
35.482
-1.271
-3.46%
1 janv. 1994
34.524
-0.959
-2.7%
1 janv. 1995
35.43
+0.906
2.63%
1 janv. 1996
34.71
-0.72
-2.03%
1 janv. 1997
33.419
-1.291
-3.72%
1 janv. 1998
32.951
-0.468
-1.4%
1 janv. 1999
32.232
-0.719
-2.18%
1 janv. 2000
31.821
-0.411
-1.27%
1 janv. 2001
33.444
+1.623
5.1%
1 janv. 2002
35.509
+2.064
6.17%
1 janv. 2003
38.067
+2.558
7.2%
1 janv. 2004
36.882
-1.185
-3.11%
1 janv. 2005
37.815
+0.933
2.53%
1 janv. 2006
39.318
+1.503
3.97%
1 janv. 2007
42.457
+3.139
7.98%
1 janv. 2008
43.552
+1.095
2.58%
1 janv. 2009
42.756
-0.796
-1.83%
1 janv. 2010
37.445
-5.311
-12.42%
1 janv. 2011
39.92
+2.474
6.61%
1 janv. 2012
39.517
-0.403
-1.01%
1 janv. 2013
39.526
+0.009
0.02%
1 janv. 2014
36.256
-3.27
-8.27%
Classement des pays selon les statistiques actuelles par années


Commentaires: