29
/fr/
fr
AIzaSyAYiBZKx7MnpbEhh9jyipgxe19OcubqV5w
April 1, 2024
78695
Bangladesh
BGD
true
2
1
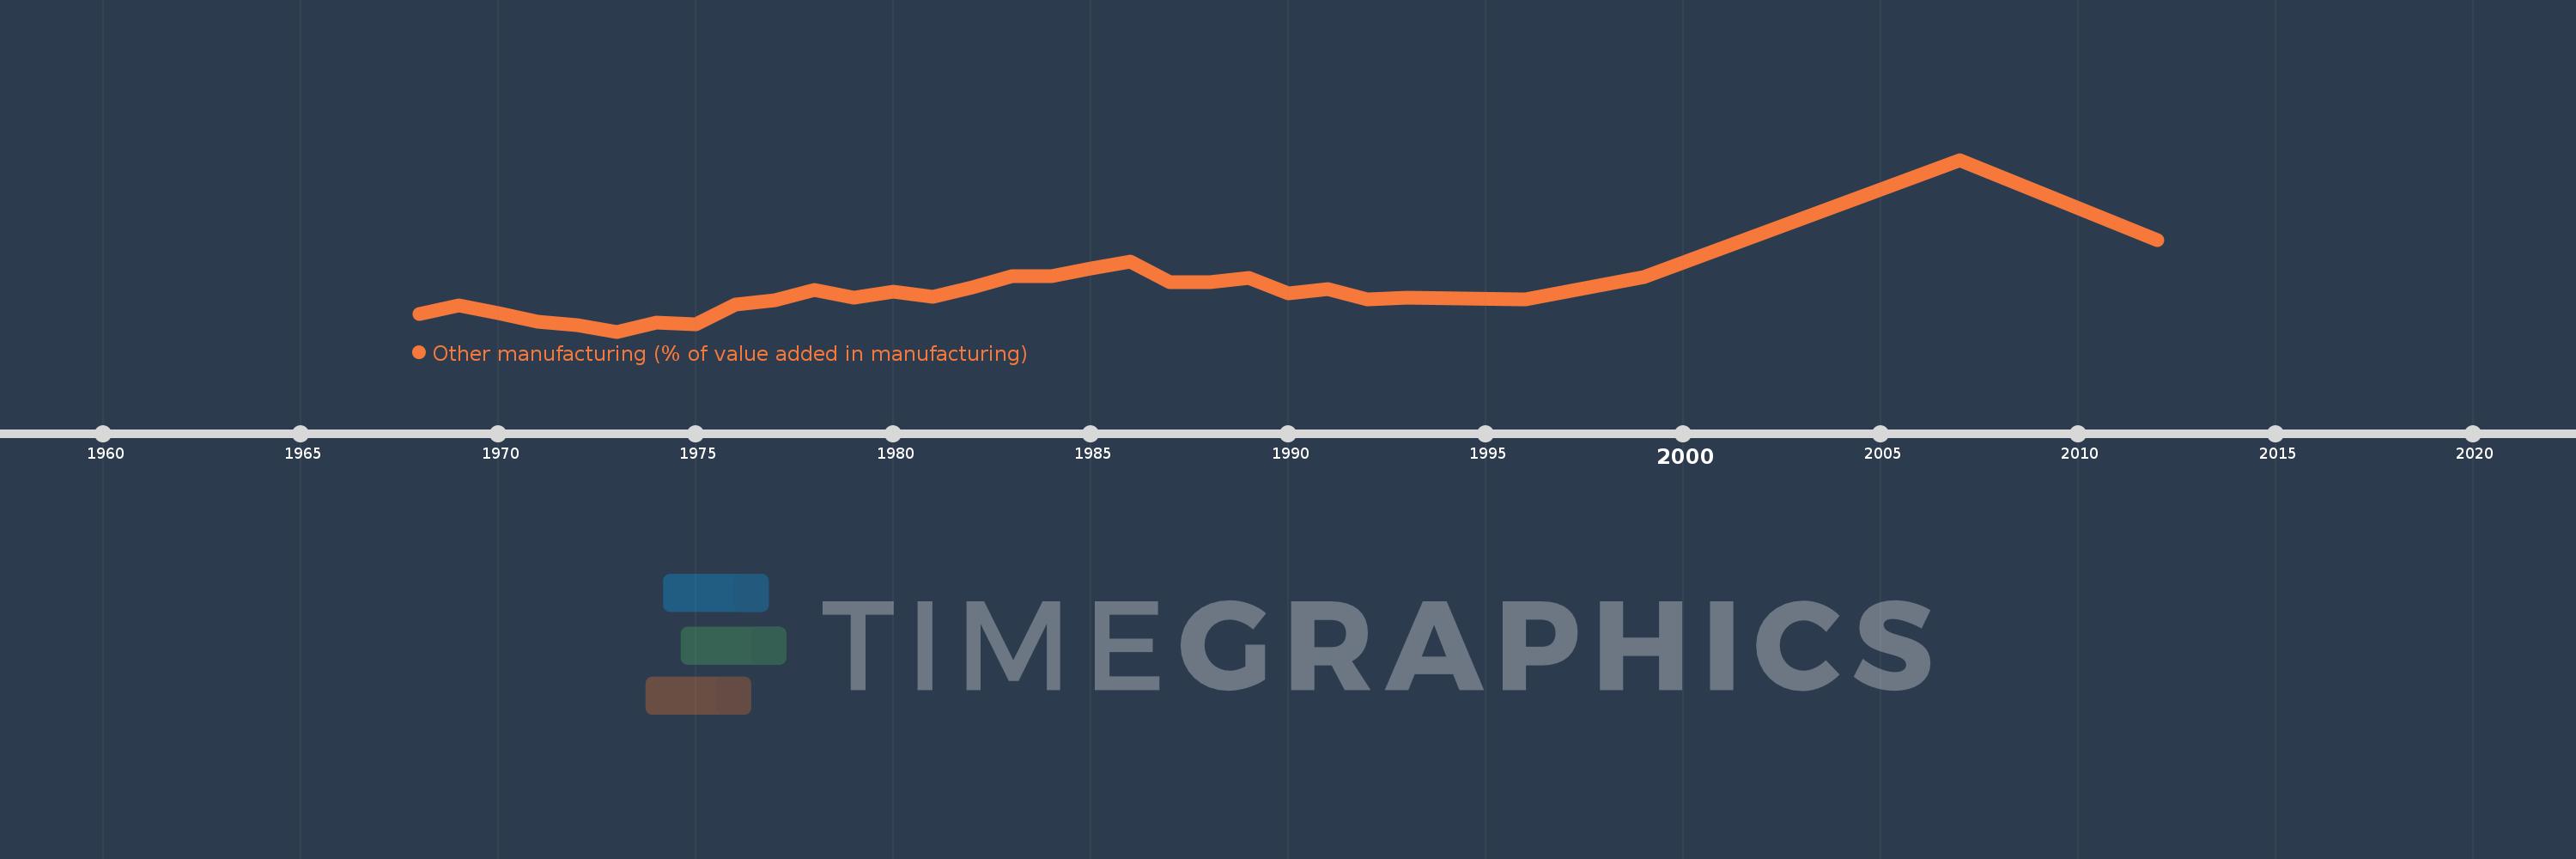
Other manufacturing (% of value added in manufacturing)
2012,2007,1999,1996,1993,1992,1991,1990,1989,1988,1987,1986,1985,1984,1983,1982,1981,1980,1979,1978,1977,1976,1975,1974,1973,1972,1971,1970,1969,1968
Cette statistique dans les autres pays:
AlbaniaAlgeriaArgentinaAustraliaAustriaAzerbaijanBahamas, TheBahrainBangladeshBarbadosBelarusBelgiumBelizeBeninBoliviaBosnia and HerzegovinaBotswanaBrazilBulgariaBurkina FasoBurundiCambodiaCameroonCanadaCentral African RepublicChileChinaColombiaCongo, Rep.Costa RicaCote d'IvoireCroatiaCubaCyprusCzech RepublicDenmarkDominican RepublicEcuadorEgypt, Arab Rep.El SalvadorEritreaEstoniaEthiopiaFijiFinlandFranceGabonGambia, TheGeorgiaGermanyGhanaGreeceGuatemalaHondurasHong Kong SAR, ChinaHungaryIcelandIndiaIndonesiaIran, Islamic Rep.IraqIrelandIsraelItalyJamaicaJapanJordanKazakhstanKenyaKorea, Rep.KuwaitKyrgyz RepublicLao PDRLatviaLebanonLesothoLibyaLithuaniaLuxembourgMacao SAR, ChinaMacedonia, FYRMadagascarMalawiMalaysiaMaltaMauritiusMexicoMoldovaMongoliaMoroccoMozambiqueNamibiaNepalNetherlandsNew ZealandNicaraguaNigerNigeriaNorwayOmanPakistanPanamaPapua New GuineaParaguayPeruPhilippinesPolandPortugalPuerto RicoQatarRomaniaRussian FederationRwandaSaudi ArabiaSenegalSerbiaSierra LeoneSingaporeSlovak RepublicSloveniaSomaliaSouth AfricaSpainSri LankaSt. LuciaSudanSwazilandSwedenSwitzerlandSyrian Arab RepublicTanzaniaThailandTongaTrinidad and TobagoTunisiaTurkeyUgandaUkraineUnited Arab EmiratesUnited KingdomUnited StatesUruguayVenezuela, RBVietnamWest Bank and GazaYemen, Rep.Zambia La ligne de temps
Cette échelle de temps montre un graphique de 1968 année à 2012 année Bangladesh. Les données jusqu'à 1967 année ne sont pas présentés. Quantité d'observations actuelles selon dates: 30.
Source (désignation):
Les indicateurs du développement mondiale
Source (organisation):
United Nations Industrial Development Organization, International Yearbook of Industrial Statistics.
Catégories:
Economy & Growth
Dernière mise à jour
23 avr. 2017
Les indicateurs de changement de valeurs selon les années
Minimum:
8.562
1 janv. 1973
Maximum:
46.351
1 janv. 2007
Pour la date d''observation
Valeur
Changement absolu
Le changement par rapport à la valeur précédente
1 janv. 1968
12.498
+12.498
0.0%
1 janv. 1969
14.233
+1.735
13.88%
1 janv. 1970
12.645
-1.587
-11.15%
1 janv. 1971
10.765
-1.88
-14.87%
1 janv. 1972
9.959
-0.806
-7.49%
1 janv. 1973
8.562
-1.397
-14.03%
1 janv. 1974
10.485
+1.923
22.45%
1 janv. 1975
10.246
-0.238
-2.27%
1 janv. 1976
14.475
+4.229
41.28%
1 janv. 1977
15.528
+1.052
7.27%
1 janv. 1978
17.695
+2.168
13.96%
1 janv. 1979
16.024
-1.672
-9.45%
1 janv. 1980
17.327
+1.304
8.14%
1 janv. 1981
16.131
-1.196
-6.9%
1 janv. 1982
18.273
+2.142
13.28%
1 janv. 1983
20.711
+2.437
13.34%
1 janv. 1984
20.796
+0.086
0.41%
1 janv. 1985
22.422
+1.626
7.82%
1 janv. 1986
24.051
+1.629
7.27%
1 janv. 1987
19.4
-4.652
-19.34%
1 janv. 1988
19.388
-0.012
-0.06%
1 janv. 1989
20.294
+0.905
4.67%
1 janv. 1990
17.02
-3.274
-16.13%
1 janv. 1991
17.945
+0.925
5.43%
1 janv. 1992
15.716
-2.229
-12.42%
1 janv. 1993
16.074
+0.357
2.27%
1 janv. 1996
15.563
-0.511
-3.18%
1 janv. 1999
20.652
+5.089
32.7%
1 janv. 2007
46.351
+25.699
124.44%
1 janv. 2012
28.603
-17.748
-38.29%
Classement des pays selon les statistiques actuelles par années


Commentaires: