29
/es/
es
AIzaSyAYiBZKx7MnpbEhh9jyipgxe19OcubqV5w
April 1, 2024
78280
Bangladesh
BGD
true
2
1
Government expenditure on education, total (% of GDP)
2014,2013,2010,2009,2008,2007,2005,2004,2003,2002,2001,2000,1998,1994,1993,1992,1991,1988,1987,1986,1985,1984,1983,1982,1981,1980
Estas estadísticas en otros países:
AfghanistanAlbaniaAlgeriaAndorraAngolaAntigua and BarbudaArab WorldArgentinaArmeniaArubaAustraliaAustriaAzerbaijanBahamas, TheBahrainBangladeshBarbadosBelarusBelgiumBelizeBeninBermudaBhutanBoliviaBotswanaBrazilBritish Virgin IslandsBrunei DarussalamBulgariaBurkina FasoBurundiCabo VerdeCambodiaCameroonCanadaCaribbean small statesCentral African RepublicCentral Europe and the BalticsChadChileChinaColombiaComorosCongo, Dem. Rep.Congo, Rep.Costa RicaCote d'IvoireCroatiaCubaCuracaoCyprusCzech RepublicDenmarkDjiboutiDominicaDominican RepublicEarly-demographic dividendEast Asia & PacificEast Asia & Pacific (excluding high income)East Asia & Pacific (IDA & IBRD countries)EcuadorEgypt, Arab Rep.El SalvadorEquatorial GuineaEritreaEstoniaEthiopiaEuro areaEurope & Central AsiaEurope & Central Asia (excluding high income)Europe & Central Asia (IDA & IBRD countries)European UnionFijiFinlandFranceGabonGambia, TheGeorgiaGermanyGhanaGreeceGrenadaGuatemalaGuineaGuinea-BissauGuyanaHaitiHeavily indebted poor countries (HIPC)High incomeHondurasHong Kong SAR, ChinaHungaryIBRD onlyIcelandIDA & IBRD totalIDA blendIDA onlyIDA totalIndiaIndonesiaIran, Islamic Rep.IraqIrelandIsraelItalyJamaicaJapanJordanKazakhstanKenyaKiribatiKorea, Rep.KuwaitKyrgyz RepublicLao PDRLate-demographic dividendLatin America & Caribbean Latin America & Caribbean (excluding high income)Latin America & the Caribbean (IDA & IBRD countries)LatviaLeast developed countries: UN classificationLebanonLesothoLiberiaLibyaLiechtensteinLithuaniaLow & middle incomeLow incomeLower middle incomeLuxembourgMacao SAR, ChinaMacedonia, FYRMadagascarMalawiMalaysiaMaldivesMaliMaltaMarshall IslandsMauritaniaMauritiusMexicoMicronesia, Fed. Sts.Middle East & North AfricaMiddle East & North Africa (excluding high income)Middle East & North Africa (IDA & IBRD countries)Middle incomeMoldovaMonacoMongoliaMoroccoMozambiqueMyanmarNamibiaNepalNetherlandsNew ZealandNicaraguaNigerNigeriaNorth AmericaNorwayOECD membersOmanOther small statesPakistanPalauPanamaPapua New GuineaParaguayPeruPhilippinesPolandPortugalPost-demographic dividendPre-demographic dividendPuerto RicoQatarRomaniaRussian FederationRwandaSamoaSan MarinoSao Tome and PrincipeSaudi ArabiaSenegalSerbiaSeychellesSierra LeoneSingaporeSlovak RepublicSloveniaSmall statesSolomon IslandsSomaliaSouth AfricaSouth AsiaSouth Asia (IDA & IBRD)South SudanSpainSri LankaSt. Kitts and NevisSt. LuciaSt. Vincent and the GrenadinesSub-Saharan Africa Sub-Saharan Africa (excluding high income)Sub-Saharan Africa (IDA & IBRD countries)SudanSwazilandSwedenSwitzerlandSyrian Arab RepublicTajikistanTanzaniaThailandTimor-LesteTogoTongaTrinidad and TobagoTunisiaTurkeyTurkmenistanTurks and Caicos IslandsTuvaluUgandaUkraineUnited Arab EmiratesUnited KingdomUnited StatesUpper middle incomeUruguayVanuatuVenezuela, RBVietnamWorldYemen, Rep.ZambiaZimbabwe línea de tiempo (timeline):
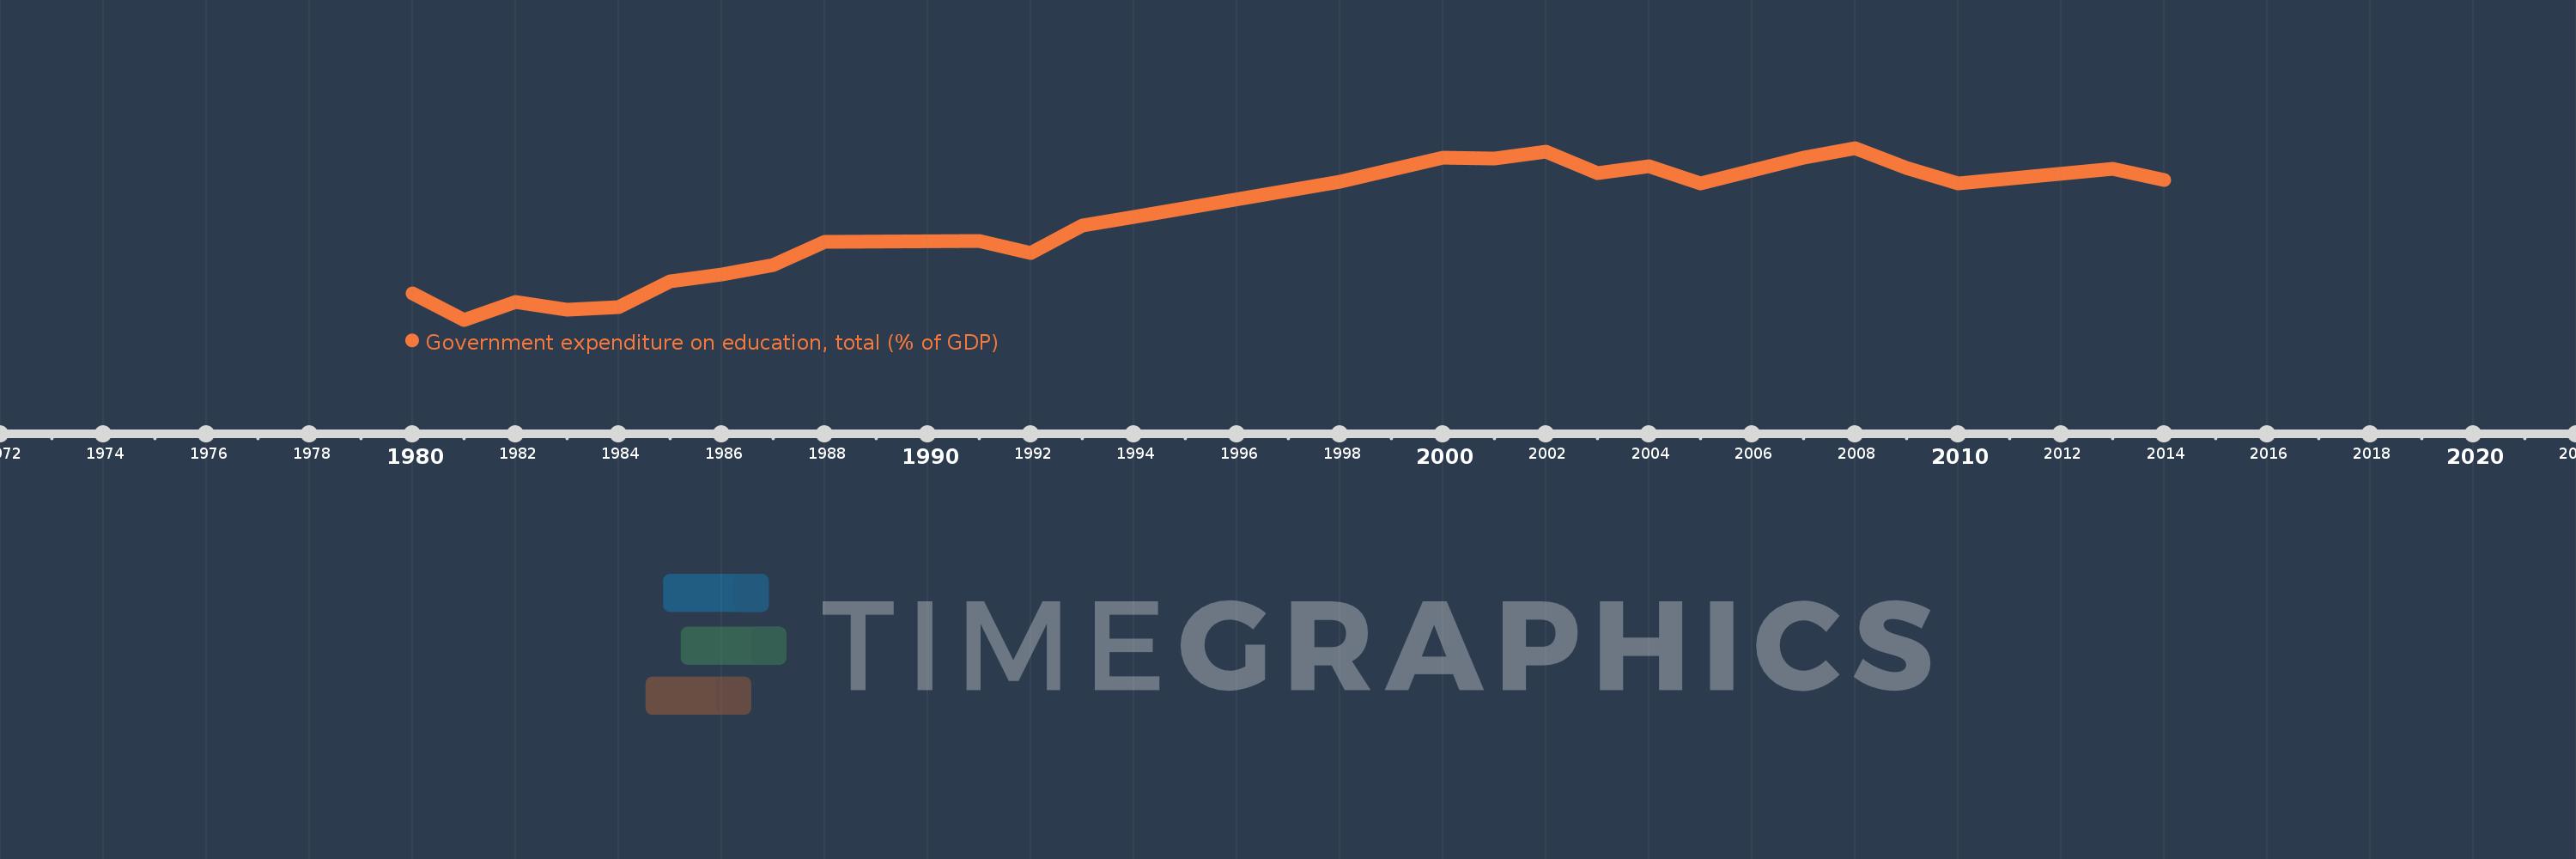
En esta escala de tiempo se presenta un gráfico de 1980 y 2014 de Bangladesh. Los datos de 1979 están ausentes. El número de observaciones reales por fecha: 26.
Fuente (nombre):
Indicadores del desarrollo mundial
Fuente (organización):
United Nations Educational, Scientific, and Cultural Organization (UNESCO) Institute for Statistics.
Categorías:
Education
Se ha actualizado:
23 abr 2017 año
Los indicadores de los cambios de valor en los últimos años
Mínimo:
0.938
1 ene 1981 año
Máximo:
2.202
1 ene 2008 año
A la fecha de observación
Valor
Cambio absoluto
El cambio con respecto al valor anterior
1 ene 1980 año
1.131
+1.131
0.0%
1 ene 1981 año
0.938
-0.193
-17.09%
1 ene 1982 año
1.071
+0.134
14.28%
1 ene 1983 año
1.012
-0.06
-5.59%
1 ene 1984 año
1.033
+0.021
2.08%
1 ene 1985 año
1.223
+0.19
18.43%
1 ene 1986 año
1.271
+0.048
3.94%
1 ene 1987 año
1.343
+0.072
5.69%
1 ene 1988 año
1.514
+0.17
12.66%
1 ene 1991 año
1.519
+0.005
0.36%
1 ene 1992 año
1.426
-0.093
-6.15%
1 ene 1993 año
1.632
+0.206
14.46%
1 ene 1994 año
1.693
+0.061
3.73%
1 ene 1998 año
1.952
+0.26
15.35%
1 ene 2000 año
2.133
+0.18
9.24%
1 ene 2001 año
2.125
-0.008
-0.36%
1 ene 2002 año
2.172
+0.047
2.21%
1 ene 2003 año
2.017
-0.155
-7.13%
1 ene 2004 año
2.069
+0.052
2.59%
1 ene 2005 año
1.94
-0.129
-6.25%
1 ene 2007 año
2.131
+0.191
9.85%
1 ene 2008 año
2.202
+0.071
3.33%
1 ene 2009 año
2.055
-0.148
-6.7%
1 ene 2010 año
1.939
-0.115
-5.6%
1 ene 2013 año
2.046
+0.106
5.49%
1 ene 2014 año
1.966
-0.08
-3.89%
Ranking de los países por los datos estadísticos actuales


Comentarios: