29
/es/
es
AIzaSyAYiBZKx7MnpbEhh9jyipgxe19OcubqV5w
April 1, 2024
29886
Euro area
EMU
false
2
1
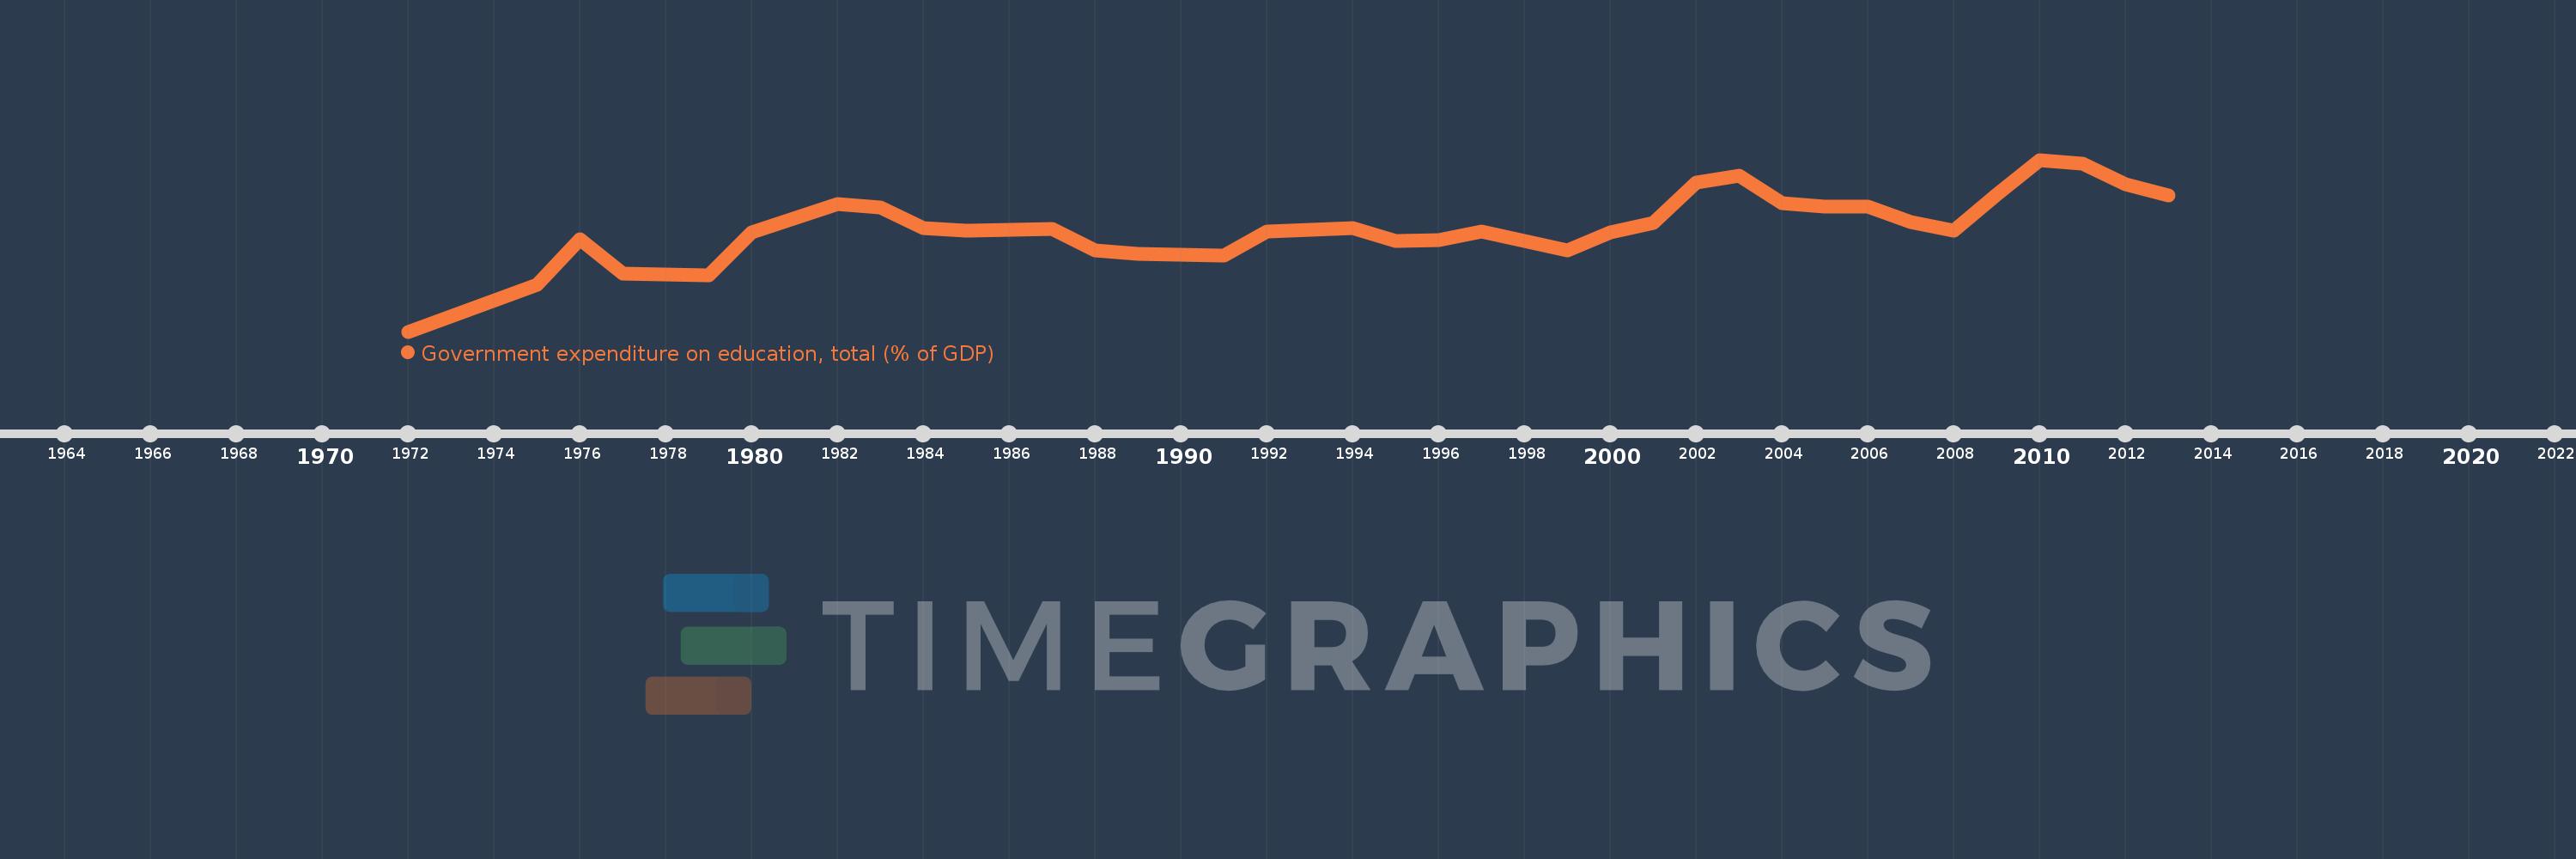
Government expenditure on education, total (% of GDP)
2013,2012,2011,2010,2009,2008,2007,2006,2005,2004,2003,2002,2001,2000,1999,1997,1996,1995,1994,1992,1991,1989,1988,1987,1985,1984,1983,1982,1980,1979,1977,1976,1975,1972
Estas estadísticas en otros países:
AfghanistanAlbaniaAlgeriaAndorraAngolaAntigua and BarbudaArab WorldArgentinaArmeniaArubaAustraliaAustriaAzerbaijanBahamas, TheBahrainBangladeshBarbadosBelarusBelgiumBelizeBeninBermudaBhutanBoliviaBotswanaBrazilBritish Virgin IslandsBrunei DarussalamBulgariaBurkina FasoBurundiCabo VerdeCambodiaCameroonCanadaCaribbean small statesCentral African RepublicCentral Europe and the BalticsChadChileChinaColombiaComorosCongo, Dem. Rep.Congo, Rep.Costa RicaCote d'IvoireCroatiaCubaCuracaoCyprusCzech RepublicDenmarkDjiboutiDominicaDominican RepublicEarly-demographic dividendEast Asia & PacificEast Asia & Pacific (excluding high income)East Asia & Pacific (IDA & IBRD countries)EcuadorEgypt, Arab Rep.El SalvadorEquatorial GuineaEritreaEstoniaEthiopiaEuro areaEurope & Central AsiaEurope & Central Asia (excluding high income)Europe & Central Asia (IDA & IBRD countries)European UnionFijiFinlandFranceGabonGambia, TheGeorgiaGermanyGhanaGreeceGrenadaGuatemalaGuineaGuinea-BissauGuyanaHaitiHeavily indebted poor countries (HIPC)High incomeHondurasHong Kong SAR, ChinaHungaryIBRD onlyIcelandIDA & IBRD totalIDA blendIDA onlyIDA totalIndiaIndonesiaIran, Islamic Rep.IraqIrelandIsraelItalyJamaicaJapanJordanKazakhstanKenyaKiribatiKorea, Rep.KuwaitKyrgyz RepublicLao PDRLate-demographic dividendLatin America & Caribbean Latin America & Caribbean (excluding high income)Latin America & the Caribbean (IDA & IBRD countries)LatviaLeast developed countries: UN classificationLebanonLesothoLiberiaLibyaLiechtensteinLithuaniaLow & middle incomeLow incomeLower middle incomeLuxembourgMacao SAR, ChinaMacedonia, FYRMadagascarMalawiMalaysiaMaldivesMaliMaltaMarshall IslandsMauritaniaMauritiusMexicoMicronesia, Fed. Sts.Middle East & North AfricaMiddle East & North Africa (excluding high income)Middle East & North Africa (IDA & IBRD countries)Middle incomeMoldovaMonacoMongoliaMoroccoMozambiqueMyanmarNamibiaNepalNetherlandsNew ZealandNicaraguaNigerNigeriaNorth AmericaNorwayOECD membersOmanOther small statesPakistanPalauPanamaPapua New GuineaParaguayPeruPhilippinesPolandPortugalPost-demographic dividendPre-demographic dividendPuerto RicoQatarRomaniaRussian FederationRwandaSamoaSan MarinoSao Tome and PrincipeSaudi ArabiaSenegalSerbiaSeychellesSierra LeoneSingaporeSlovak RepublicSloveniaSmall statesSolomon IslandsSomaliaSouth AfricaSouth AsiaSouth Asia (IDA & IBRD)South SudanSpainSri LankaSt. Kitts and NevisSt. LuciaSt. Vincent and the GrenadinesSub-Saharan Africa Sub-Saharan Africa (excluding high income)Sub-Saharan Africa (IDA & IBRD countries)SudanSwazilandSwedenSwitzerlandSyrian Arab RepublicTajikistanTanzaniaThailandTimor-LesteTogoTongaTrinidad and TobagoTunisiaTurkeyTurkmenistanTurks and Caicos IslandsTuvaluUgandaUkraineUnited Arab EmiratesUnited KingdomUnited StatesUpper middle incomeUruguayVanuatuVenezuela, RBVietnamWorldYemen, Rep.ZambiaZimbabwe línea de tiempo (timeline):
En esta escala de tiempo se presenta un gráfico de 1972 y 2013 de Euro area. Los datos de 1971 están ausentes. El número de observaciones reales por fecha: 34.
Fuente (nombre):
Indicadores del desarrollo mundial
Fuente (organización):
United Nations Educational, Scientific, and Cultural Organization (UNESCO) Institute for Statistics.
Categorías:
Education
Se ha actualizado:
23 abr 2017 año
Los indicadores de los cambios de valor en los últimos años
Mínimo:
3.728
1 ene 1972 año
Máximo:
5.578
1 ene 2010 año
A la fecha de observación
Valor
Cambio absoluto
El cambio con respecto al valor anterior
1 ene 1972 año
3.728
+3.728
0.0%
1 ene 1975 año
4.228
+0.5
13.41%
1 ene 1976 año
4.722
+0.494
11.69%
1 ene 1977 año
4.356
-0.366
-7.74%
1 ene 1979 año
4.332
-0.024
-0.55%
1 ene 1980 año
4.793
+0.461
10.64%
1 ene 1982 año
5.105
+0.312
6.51%
1 ene 1983 año
5.066
-0.039
-0.77%
1 ene 1984 año
4.843
-0.223
-4.4%
1 ene 1985 año
4.819
-0.024
-0.5%
1 ene 1987 año
4.834
+0.015
0.31%
1 ene 1988 año
4.603
-0.231
-4.78%
1 ene 1989 año
4.565
-0.038
-0.82%
1 ene 1991 año
4.549
-0.016
-0.36%
1 ene 1992 año
4.802
+0.254
5.58%
1 ene 1994 año
4.84
+0.038
0.79%
1 ene 1995 año
4.706
-0.134
-2.77%
1 ene 1996 año
4.711
+0.004
0.09%
1 ene 1997 año
4.802
+0.091
1.94%
1 ene 1999 año
4.599
-0.203
-4.23%
1 ene 2000 año
4.801
+0.203
4.41%
1 ene 2001 año
4.894
+0.092
1.92%
1 ene 2002 año
5.335
+0.441
9.02%
1 ene 2003 año
5.409
+0.074
1.39%
1 ene 2004 año
5.109
-0.301
-5.56%
1 ene 2005 año
5.078
-0.03
-0.59%
1 ene 2006 año
5.071
-0.008
-0.15%
1 ene 2007 año
4.908
-0.163
-3.21%
1 ene 2008 año
4.819
-0.089
-1.82%
1 ene 2009 año
5.202
+0.383
7.94%
1 ene 2010 año
5.578
+0.377
7.24%
1 ene 2011 año
5.541
-0.037
-0.67%
1 ene 2012 año
5.319
-0.222
-4.01%
1 ene 2013 año
5.196
-0.123
-2.31%
Ranking de los países por los datos estadísticos actuales


Comentarios: