29
/es/
es
AIzaSyAYiBZKx7MnpbEhh9jyipgxe19OcubqV5w
April 1, 2024
255211
Swaziland
SWZ
true
2
1
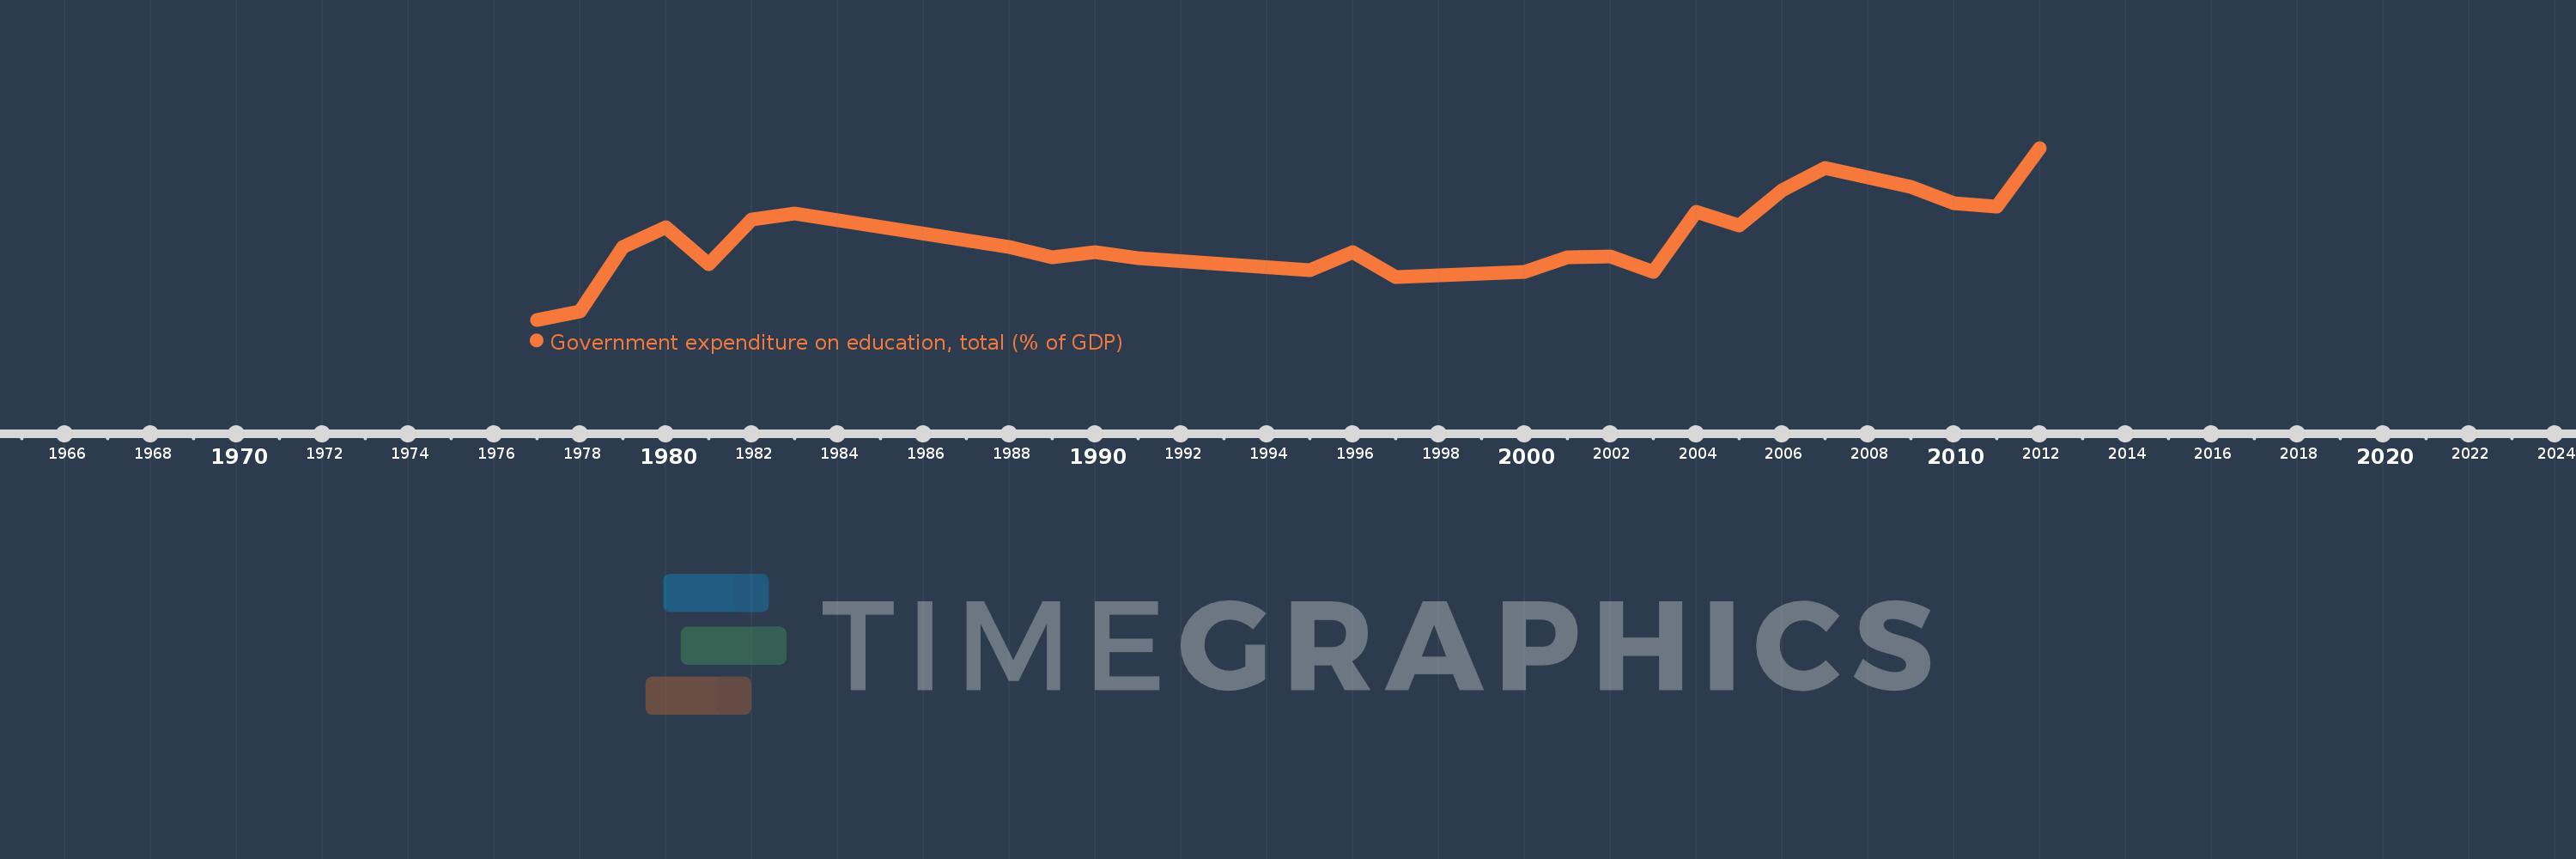
Government expenditure on education, total (% of GDP)
2012,2011,2010,2009,2007,2006,2005,2004,2003,2002,2001,2000,1997,1996,1995,1991,1990,1989,1988,1983,1982,1981,1980,1979,1978,1977
Estas estadísticas en otros países:
AfghanistanAlbaniaAlgeriaAndorraAngolaAntigua and BarbudaArab WorldArgentinaArmeniaArubaAustraliaAustriaAzerbaijanBahamas, TheBahrainBangladeshBarbadosBelarusBelgiumBelizeBeninBermudaBhutanBoliviaBotswanaBrazilBritish Virgin IslandsBrunei DarussalamBulgariaBurkina FasoBurundiCabo VerdeCambodiaCameroonCanadaCaribbean small statesCentral African RepublicCentral Europe and the BalticsChadChileChinaColombiaComorosCongo, Dem. Rep.Congo, Rep.Costa RicaCote d'IvoireCroatiaCubaCuracaoCyprusCzech RepublicDenmarkDjiboutiDominicaDominican RepublicEarly-demographic dividendEast Asia & PacificEast Asia & Pacific (excluding high income)East Asia & Pacific (IDA & IBRD countries)EcuadorEgypt, Arab Rep.El SalvadorEquatorial GuineaEritreaEstoniaEthiopiaEuro areaEurope & Central AsiaEurope & Central Asia (excluding high income)Europe & Central Asia (IDA & IBRD countries)European UnionFijiFinlandFranceGabonGambia, TheGeorgiaGermanyGhanaGreeceGrenadaGuatemalaGuineaGuinea-BissauGuyanaHaitiHeavily indebted poor countries (HIPC)High incomeHondurasHong Kong SAR, ChinaHungaryIBRD onlyIcelandIDA & IBRD totalIDA blendIDA onlyIDA totalIndiaIndonesiaIran, Islamic Rep.IraqIrelandIsraelItalyJamaicaJapanJordanKazakhstanKenyaKiribatiKorea, Rep.KuwaitKyrgyz RepublicLao PDRLate-demographic dividendLatin America & Caribbean Latin America & Caribbean (excluding high income)Latin America & the Caribbean (IDA & IBRD countries)LatviaLeast developed countries: UN classificationLebanonLesothoLiberiaLibyaLiechtensteinLithuaniaLow & middle incomeLow incomeLower middle incomeLuxembourgMacao SAR, ChinaMacedonia, FYRMadagascarMalawiMalaysiaMaldivesMaliMaltaMarshall IslandsMauritaniaMauritiusMexicoMicronesia, Fed. Sts.Middle East & North AfricaMiddle East & North Africa (excluding high income)Middle East & North Africa (IDA & IBRD countries)Middle incomeMoldovaMonacoMongoliaMoroccoMozambiqueMyanmarNamibiaNepalNetherlandsNew ZealandNicaraguaNigerNigeriaNorth AmericaNorwayOECD membersOmanOther small statesPakistanPalauPanamaPapua New GuineaParaguayPeruPhilippinesPolandPortugalPost-demographic dividendPre-demographic dividendPuerto RicoQatarRomaniaRussian FederationRwandaSamoaSan MarinoSao Tome and PrincipeSaudi ArabiaSenegalSerbiaSeychellesSierra LeoneSingaporeSlovak RepublicSloveniaSmall statesSolomon IslandsSomaliaSouth AfricaSouth AsiaSouth Asia (IDA & IBRD)South SudanSpainSri LankaSt. Kitts and NevisSt. LuciaSt. Vincent and the GrenadinesSub-Saharan Africa Sub-Saharan Africa (excluding high income)Sub-Saharan Africa (IDA & IBRD countries)SudanSwazilandSwedenSwitzerlandSyrian Arab RepublicTajikistanTanzaniaThailandTimor-LesteTogoTongaTrinidad and TobagoTunisiaTurkeyTurkmenistanTurks and Caicos IslandsTuvaluUgandaUkraineUnited Arab EmiratesUnited KingdomUnited StatesUpper middle incomeUruguayVanuatuVenezuela, RBVietnamWorldYemen, Rep.ZambiaZimbabwe línea de tiempo (timeline):
En esta escala de tiempo se presenta un gráfico de 1977 y 2012 de Swaziland. Los datos de 1976 están ausentes. El número de observaciones reales por fecha: 26.
Fuente (nombre):
Indicadores del desarrollo mundial
Fuente (organización):
United Nations Educational, Scientific, and Cultural Organization (UNESCO) Institute for Statistics.
Categorías:
Education
Se ha actualizado:
23 abr 2017 año
Los indicadores de los cambios de valor en los últimos años
Mínimo:
3.714
1 ene 1977 año
Máximo:
8.637
1 ene 2012 año
A la fecha de observación
Valor
Cambio absoluto
El cambio con respecto al valor anterior
1 ene 1977 año
3.714
+3.714
0.0%
1 ene 1978 año
3.944
+0.23
6.19%
1 ene 1979 año
5.797
+1.852
46.96%
1 ene 1980 año
6.364
+0.568
9.79%
1 ene 1981 año
5.297
-1.067
-16.77%
1 ene 1982 año
6.584
+1.287
24.29%
1 ene 1983 año
6.754
+0.17
2.58%
1 ene 1988 año
5.802
-0.951
-14.09%
1 ene 1989 año
5.512
-0.291
-5.01%
1 ene 1990 año
5.661
+0.15
2.72%
1 ene 1991 año
5.485
-0.177
-3.12%
1 ene 1995 año
5.14
-0.344
-6.28%
1 ene 1996 año
5.653
+0.513
9.98%
1 ene 1997 año
4.938
-0.715
-12.65%
1 ene 2000 año
5.091
+0.153
3.09%
1 ene 2001 año
5.508
+0.418
8.2%
1 ene 2002 año
5.516
+0.008
0.14%
1 ene 2003 año
5.077
-0.44
-7.97%
1 ene 2004 año
6.805
+1.729
34.05%
1 ene 2005 año
6.403
-0.402
-5.91%
1 ene 2006 año
7.421
+1.018
15.9%
1 ene 2007 año
8.062
+0.641
8.64%
1 ene 2009 año
7.519
-0.543
-6.73%
1 ene 2010 año
7.059
-0.46
-6.11%
1 ene 2011 año
6.966
-0.093
-1.32%
1 ene 2012 año
8.637
+1.671
23.98%
Ranking de los países por los datos estadísticos actuales


Comentarios: