29
/es/
es
AIzaSyAYiBZKx7MnpbEhh9jyipgxe19OcubqV5w
April 1, 2024
73946
Austria
AUT
true
2
1
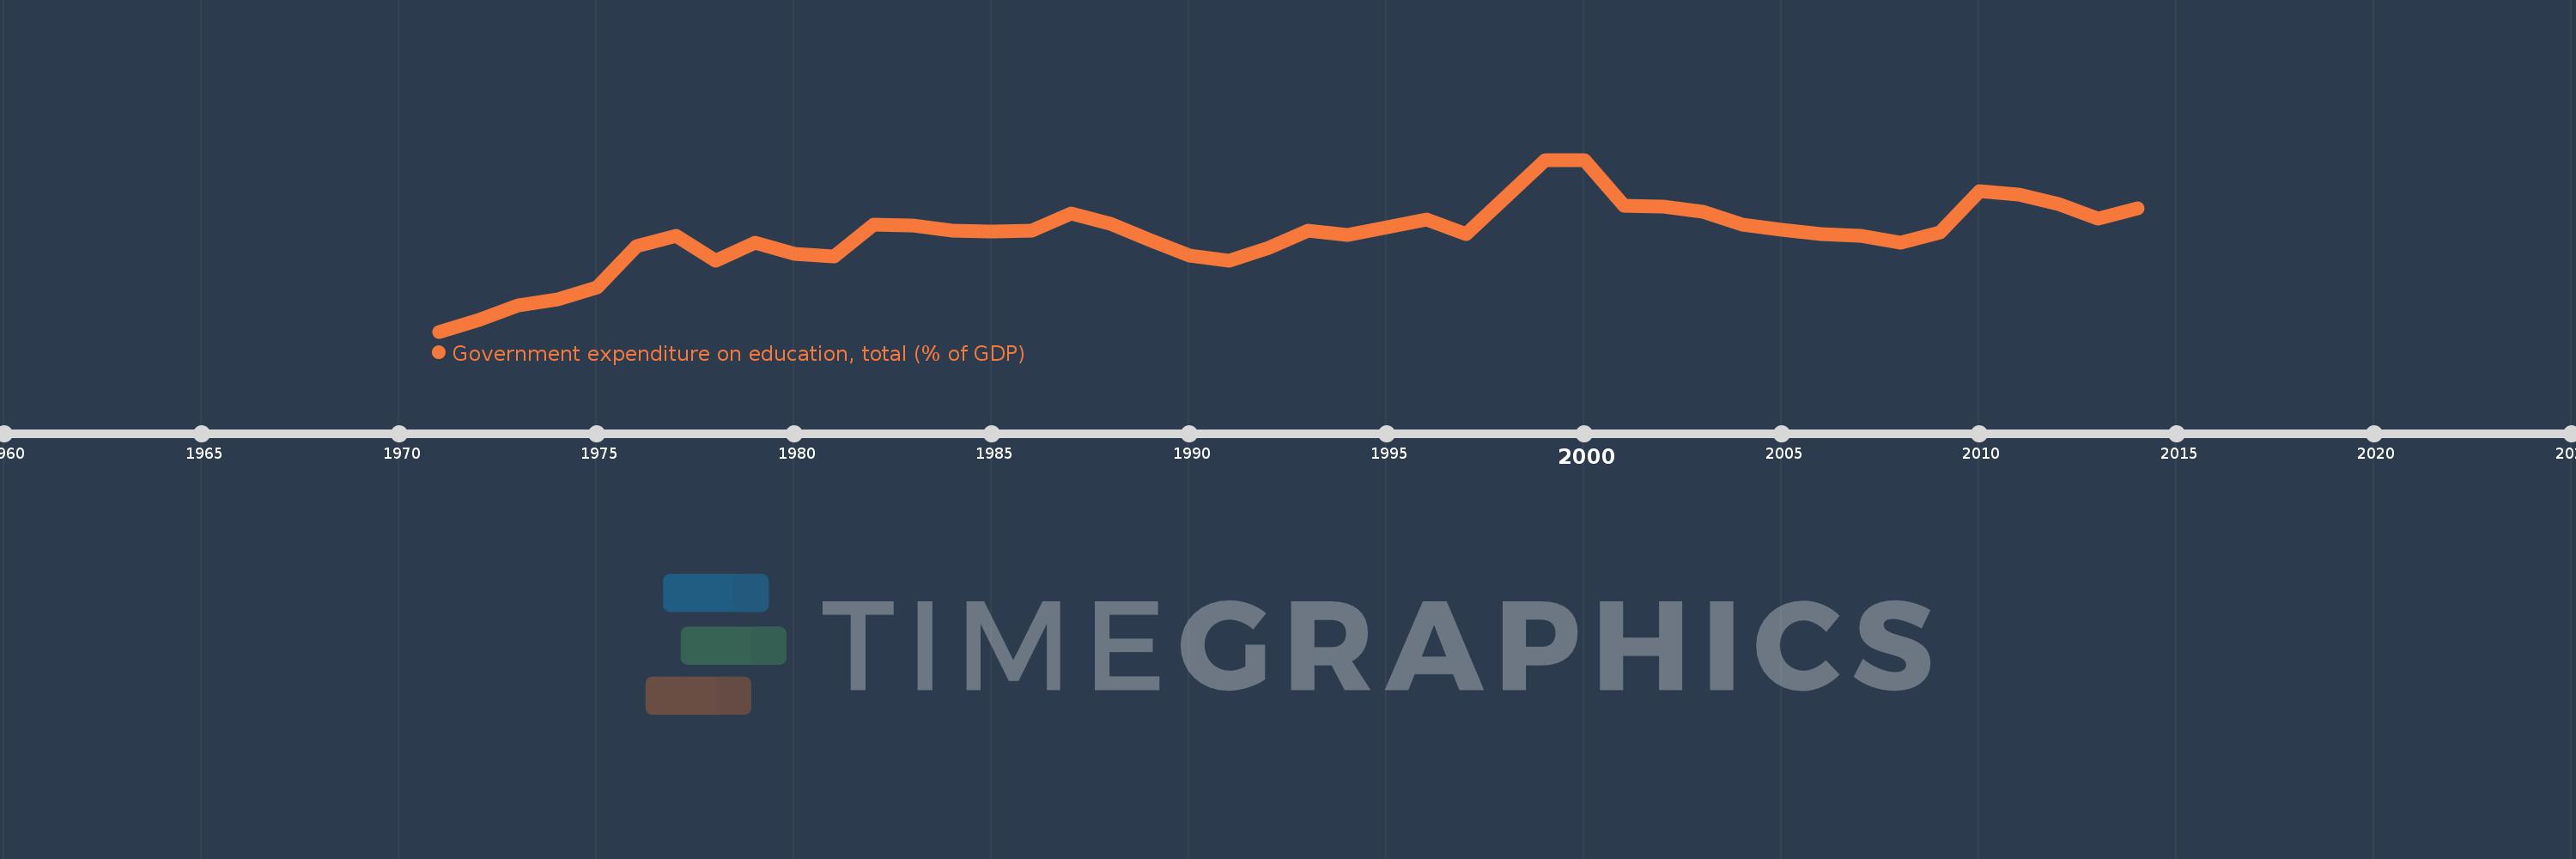
Government expenditure on education, total (% of GDP)
2014,2013,2012,2011,2010,2009,2008,2007,2006,2005,2004,2003,2002,2001,2000,1999,1997,1996,1994,1993,1992,1991,1990,1989,1988,1987,1986,1985,1984,1983,1982,1981,1980,1979,1978,1977,1976,1975,1974,1973,1972,1971
Estas estadísticas en otros países:
AfghanistanAlbaniaAlgeriaAndorraAngolaAntigua and BarbudaArab WorldArgentinaArmeniaArubaAustraliaAustriaAzerbaijanBahamas, TheBahrainBangladeshBarbadosBelarusBelgiumBelizeBeninBermudaBhutanBoliviaBotswanaBrazilBritish Virgin IslandsBrunei DarussalamBulgariaBurkina FasoBurundiCabo VerdeCambodiaCameroonCanadaCaribbean small statesCentral African RepublicCentral Europe and the BalticsChadChileChinaColombiaComorosCongo, Dem. Rep.Congo, Rep.Costa RicaCote d'IvoireCroatiaCubaCuracaoCyprusCzech RepublicDenmarkDjiboutiDominicaDominican RepublicEarly-demographic dividendEast Asia & PacificEast Asia & Pacific (excluding high income)East Asia & Pacific (IDA & IBRD countries)EcuadorEgypt, Arab Rep.El SalvadorEquatorial GuineaEritreaEstoniaEthiopiaEuro areaEurope & Central AsiaEurope & Central Asia (excluding high income)Europe & Central Asia (IDA & IBRD countries)European UnionFijiFinlandFranceGabonGambia, TheGeorgiaGermanyGhanaGreeceGrenadaGuatemalaGuineaGuinea-BissauGuyanaHaitiHeavily indebted poor countries (HIPC)High incomeHondurasHong Kong SAR, ChinaHungaryIBRD onlyIcelandIDA & IBRD totalIDA blendIDA onlyIDA totalIndiaIndonesiaIran, Islamic Rep.IraqIrelandIsraelItalyJamaicaJapanJordanKazakhstanKenyaKiribatiKorea, Rep.KuwaitKyrgyz RepublicLao PDRLate-demographic dividendLatin America & Caribbean Latin America & Caribbean (excluding high income)Latin America & the Caribbean (IDA & IBRD countries)LatviaLeast developed countries: UN classificationLebanonLesothoLiberiaLibyaLiechtensteinLithuaniaLow & middle incomeLow incomeLower middle incomeLuxembourgMacao SAR, ChinaMacedonia, FYRMadagascarMalawiMalaysiaMaldivesMaliMaltaMarshall IslandsMauritaniaMauritiusMexicoMicronesia, Fed. Sts.Middle East & North AfricaMiddle East & North Africa (excluding high income)Middle East & North Africa (IDA & IBRD countries)Middle incomeMoldovaMonacoMongoliaMoroccoMozambiqueMyanmarNamibiaNepalNetherlandsNew ZealandNicaraguaNigerNigeriaNorth AmericaNorwayOECD membersOmanOther small statesPakistanPalauPanamaPapua New GuineaParaguayPeruPhilippinesPolandPortugalPost-demographic dividendPre-demographic dividendPuerto RicoQatarRomaniaRussian FederationRwandaSamoaSan MarinoSao Tome and PrincipeSaudi ArabiaSenegalSerbiaSeychellesSierra LeoneSingaporeSlovak RepublicSloveniaSmall statesSolomon IslandsSomaliaSouth AfricaSouth AsiaSouth Asia (IDA & IBRD)South SudanSpainSri LankaSt. Kitts and NevisSt. LuciaSt. Vincent and the GrenadinesSub-Saharan Africa Sub-Saharan Africa (excluding high income)Sub-Saharan Africa (IDA & IBRD countries)SudanSwazilandSwedenSwitzerlandSyrian Arab RepublicTajikistanTanzaniaThailandTimor-LesteTogoTongaTrinidad and TobagoTunisiaTurkeyTurkmenistanTurks and Caicos IslandsTuvaluUgandaUkraineUnited Arab EmiratesUnited KingdomUnited StatesUpper middle incomeUruguayVanuatuVenezuela, RBVietnamWorldYemen, Rep.ZambiaZimbabwe línea de tiempo (timeline):
En esta escala de tiempo se presenta un gráfico de 1971 y 2014 de Austria. Los datos de 1970 están ausentes. El número de observaciones reales por fecha: 42.
Fuente (nombre):
Indicadores del desarrollo mundial
Fuente (organización):
United Nations Educational, Scientific, and Cultural Organization (UNESCO) Institute for Statistics.
Categorías:
Education
Se ha actualizado:
23 abr 2017 año
Los indicadores de los cambios de valor en los últimos años
Mínimo:
4.157
1 ene 1971 año
Máximo:
6.125
1 ene 2000 año
A la fecha de observación
Valor
Cambio absoluto
El cambio con respecto al valor anterior
1 ene 1971 año
4.157
+4.157
0.0%
1 ene 1972 año
4.293
+0.136
3.26%
1 ene 1973 año
4.461
+0.168
3.92%
1 ene 1974 año
4.526
+0.065
1.47%
1 ene 1975 año
4.667
+0.141
3.11%
1 ene 1976 año
5.14
+0.473
10.14%
1 ene 1977 año
5.25
+0.11
2.14%
1 ene 1978 año
4.966
-0.284
-5.42%
1 ene 1979 año
5.172
+0.206
4.15%
1 ene 1980 año
5.05
-0.122
-2.36%
1 ene 1981 año
5.021
-0.029
-0.58%
1 ene 1982 año
5.381
+0.36
7.16%
1 ene 1983 año
5.376
-0.005
-0.09%
1 ene 1984 año
5.317
-0.059
-1.1%
1 ene 1985 año
5.307
-0.009
-0.18%
1 ene 1986 año
5.31
+0.003
0.05%
1 ene 1987 año
5.513
+0.203
3.83%
1 ene 1988 año
5.389
-0.124
-2.25%
1 ene 1989 año
5.203
-0.186
-3.45%
1 ene 1990 año
5.03
-0.173
-3.32%
1 ene 1991 año
4.969
-0.061
-1.21%
1 ene 1992 año
5.116
+0.146
2.94%
1 ene 1993 año
5.31
+0.194
3.8%
1 ene 1994 año
5.265
-0.045
-0.85%
1 ene 1996 año
5.441
+0.177
3.36%
1 ene 1997 año
5.272
-0.17
-3.12%
1 ene 1999 año
6.12
+0.848
16.09%
1 ene 2000 año
6.125
+0.005
0.09%
1 ene 2001 año
5.6
-0.526
-8.58%
1 ene 2002 año
5.586
-0.013
-0.24%
1 ene 2003 año
5.533
-0.054
-0.96%
1 ene 2004 año
5.382
-0.151
-2.73%
1 ene 2005 año
5.321
-0.061
-1.13%
1 ene 2006 año
5.271
-0.049
-0.93%
1 ene 2007 año
5.253
-0.019
-0.35%
1 ene 2008 año
5.177
-0.076
-1.45%
1 ene 2009 año
5.297
+0.12
2.33%
1 ene 2010 año
5.767
+0.47
8.88%
1 ene 2011 año
5.725
-0.042
-0.73%
1 ene 2012 año
5.619
-0.106
-1.84%
1 ene 2013 año
5.453
-0.166
-2.96%
1 ene 2014 año
5.565
+0.111
2.04%
Ranking de los países por los datos estadísticos actuales


Comentarios: