29
/es/
es
AIzaSyAYiBZKx7MnpbEhh9jyipgxe19OcubqV5w
April 1, 2024
78117
Bangladesh
BGD
true
2
1
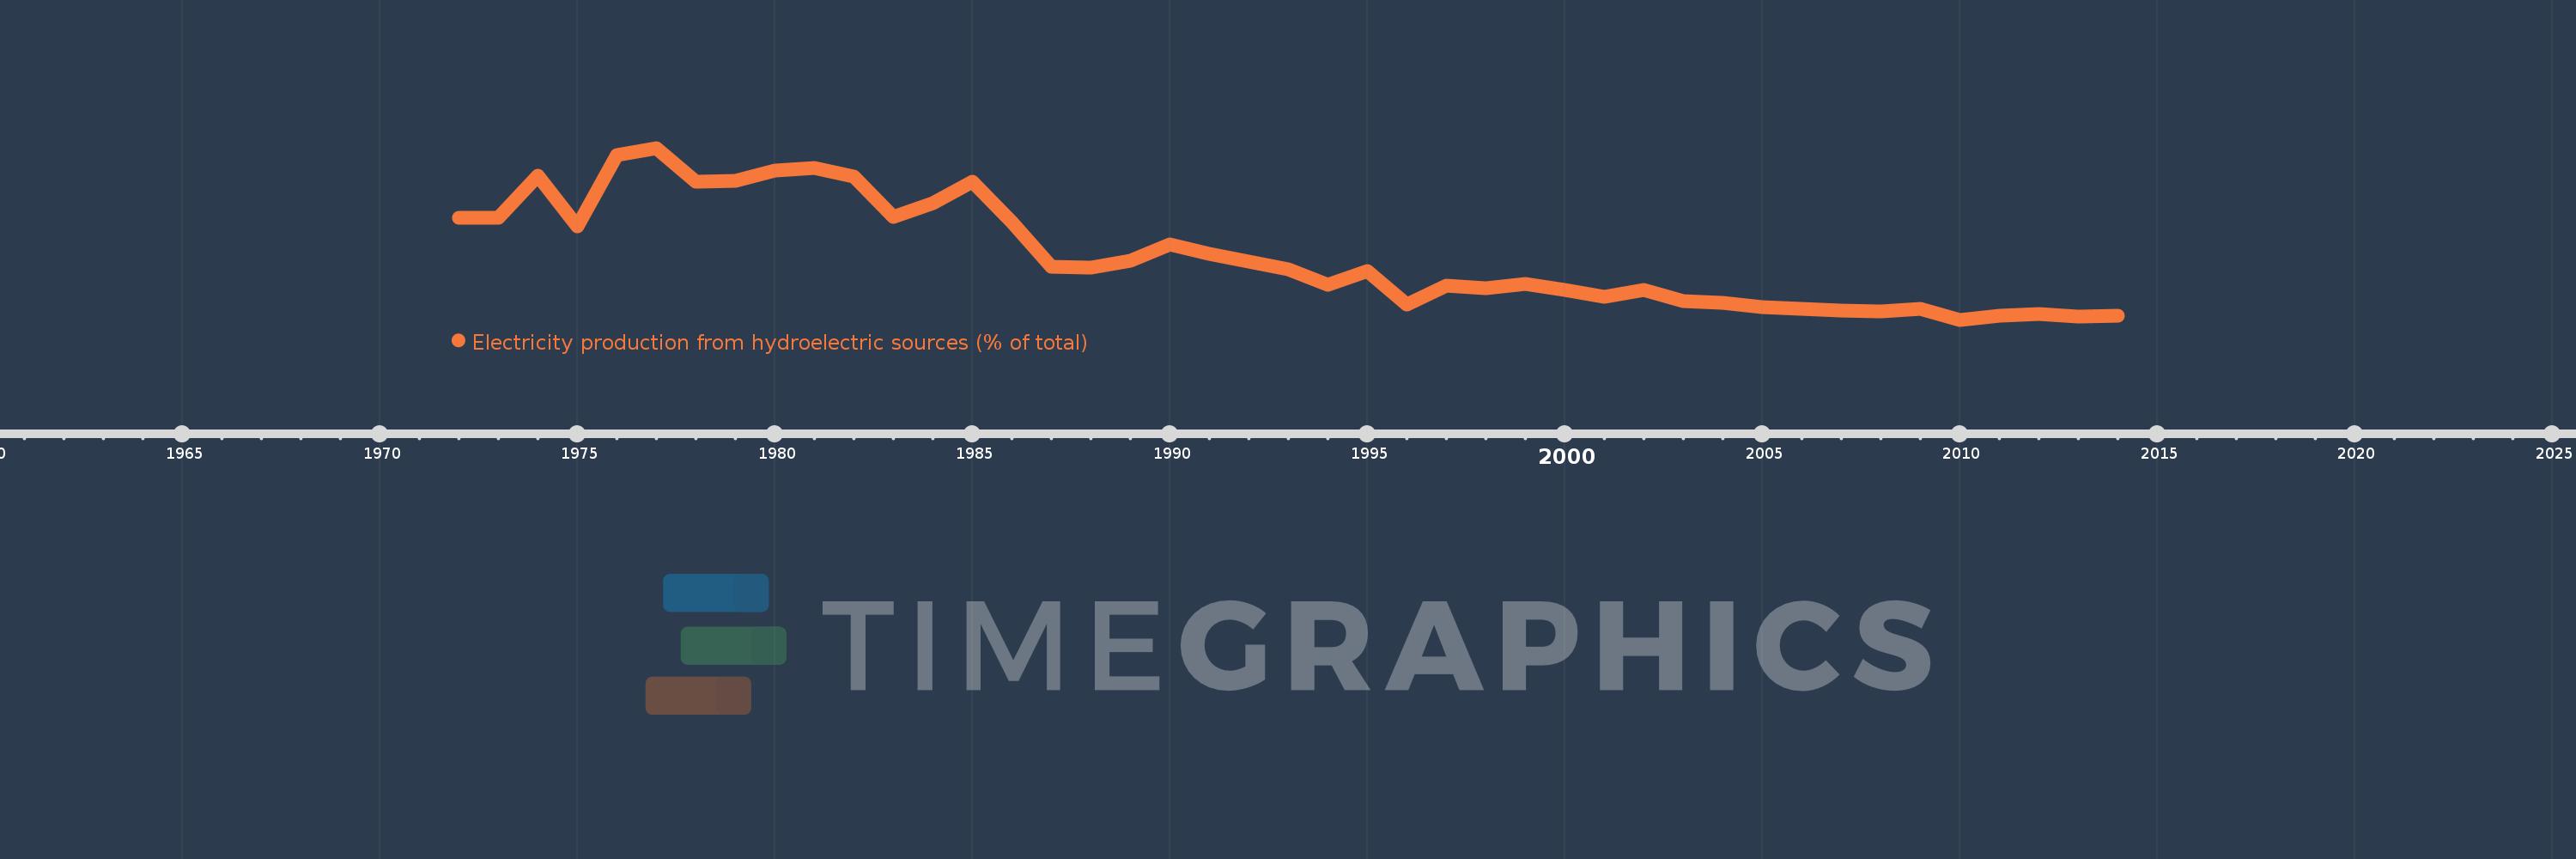
Electricity production from hydroelectric sources (% of total)
2014,2013,2012,2011,2010,2009,2008,2007,2006,2005,2004,2003,2002,2001,2000,1999,1998,1997,1996,1995,1994,1993,1992,1991,1990,1989,1988,1987,1986,1985,1984,1983,1982,1981,1980,1979,1978,1977,1976,1975,1974,1973,1972
Estas estadísticas en otros países:
AlbaniaAlgeriaAngolaArab WorldArgentinaArmeniaAustraliaAustriaAzerbaijanBahrainBangladeshBelarusBelgiumBeninBoliviaBosnia and HerzegovinaBotswanaBrazilBrunei DarussalamBulgariaCambodiaCameroonCanadaCentral Europe and the BalticsChileChinaColombiaCongo, Dem. Rep.Congo, Rep.Costa RicaCote d'IvoireCroatiaCubaCuracaoCyprusCzech RepublicDenmarkDominican RepublicEarly-demographic dividendEast Asia & PacificEast Asia & Pacific (excluding high income)East Asia & Pacific (IDA & IBRD countries)EcuadorEgypt, Arab Rep.El SalvadorEritreaEstoniaEthiopiaEuro areaEurope & Central AsiaEurope & Central Asia (excluding high income)Europe & Central Asia (IDA & IBRD countries)European UnionFinlandFragile and conflict affected situationsFranceGabonGeorgiaGermanyGhanaGibraltarGreeceGuatemalaHaitiHeavily indebted poor countries (HIPC)High incomeHondurasHong Kong SAR, ChinaHungaryIBRD onlyIcelandIDA & IBRD totalIDA blendIDA onlyIDA totalIndiaIndonesiaIran, Islamic Rep.IraqIrelandIsraelItalyJamaicaJapanJordanKazakhstanKenyaKorea, Dem. People’s Rep.Korea, Rep.KosovoKuwaitKyrgyz RepublicLate-demographic dividendLatin America & Caribbean Latin America & Caribbean (excluding high income)Latin America & the Caribbean (IDA & IBRD countries)LatviaLeast developed countries: UN classificationLebanonLibyaLithuaniaLow & middle incomeLower middle incomeLuxembourgMacedonia, FYRMalaysiaMaltaMauritiusMexicoMiddle East & North AfricaMiddle East & North Africa (excluding high income)Middle East & North Africa (IDA & IBRD countries)Middle incomeMoldovaMongoliaMontenegroMoroccoMozambiqueMyanmarNamibiaNepalNetherlandsNew ZealandNicaraguaNigerNigeriaNorth AmericaNorwayOECD membersOmanOther small statesPakistanPanamaParaguayPeruPhilippinesPolandPortugalPost-demographic dividendPre-demographic dividendQatarRomaniaRussian FederationSaudi ArabiaSenegalSerbiaSingaporeSlovak RepublicSloveniaSmall statesSouth AfricaSouth AsiaSouth Asia (IDA & IBRD)South SudanSpainSri LankaSub-Saharan Africa Sub-Saharan Africa (excluding high income)Sub-Saharan Africa (IDA & IBRD countries)SudanSwedenSwitzerlandSyrian Arab RepublicTajikistanTanzaniaThailandTogoTrinidad and TobagoTunisiaTurkeyTurkmenistanUkraineUnited Arab EmiratesUnited KingdomUnited StatesUpper middle incomeUruguayUzbekistanVenezuela, RBVietnamWorldYemen, Rep.ZambiaZimbabwe línea de tiempo (timeline):
En esta escala de tiempo se presenta un gráfico de 1972 y 2014 de Bangladesh. Los datos de 1971 están ausentes. El número de observaciones reales por fecha: 43.
Fuente (nombre):
Indicadores del desarrollo mundial
Fuente (organización):
IEA Statistics © OECD/IEA 2014 (http://www.iea.org/stats/index.asp), subject to https://www.iea.org/t&c/termsandconditions/
Categorías:
Energy & Mining, Climate Change, Infrastructure
Se ha actualizado:
23 abr 2017 año
Los indicadores de los cambios de valor en los últimos años
Mínimo:
1.122
1 ene 2010 año
Máximo:
27.925
1 ene 1977 año
A la fecha de observación
Valor
Cambio absoluto
El cambio con respecto al valor anterior
1 ene 1972 año
16.99
+16.99
0.0%
1 ene 1973 año
16.99
0.0
0.0%
1 ene 1974 año
23.575
+6.585
38.76%
1 ene 1975 año
15.688
-7.888
-33.46%
1 ene 1976 año
26.798
+11.11
70.82%
1 ene 1977 año
27.925
+1.128
4.21%
1 ene 1978 año
22.596
-5.33
-19.09%
1 ene 1979 año
22.803
+0.207
0.92%
1 ene 1980 año
24.438
+1.635
7.17%
1 ene 1981 año
24.777
+0.339
1.39%
1 ene 1982 año
23.479
-1.298
-5.24%
1 ene 1983 año
17.227
-6.252
-26.63%
1 ene 1984 año
19.283
+2.057
11.94%
1 ene 1985 año
22.617
+3.334
17.29%
1 ene 1986 año
16.321
-6.297
-27.84%
1 ene 1987 año
9.375
-6.946
-42.56%
1 ene 1988 año
9.254
-0.121
-1.29%
1 ene 1989 año
10.32
+1.066
11.52%
1 ene 1990 año
12.93
+2.611
25.3%
1 ene 1991 año
11.433
-1.497
-11.58%
1 ene 1992 año
10.133
-1.3
-11.37%
1 ene 1993 año
8.95
-1.183
-11.68%
1 ene 1994 año
6.604
-2.345
-26.21%
1 ene 1995 año
8.657
+2.053
31.08%
1 ene 1996 año
3.443
-5.214
-60.23%
1 ene 1997 año
6.441
+2.998
87.09%
1 ene 1998 año
6.063
-0.377
-5.86%
1 ene 1999 año
6.715
+0.651
10.74%
1 ene 2000 año
5.765
-0.95
-14.15%
1 ene 2001 año
4.749
-1.015
-17.62%
1 ene 2002 año
5.71
+0.96
20.22%
1 ene 2003 año
4.013
-1.697
-29.72%
1 ene 2004 año
3.8
-0.213
-5.31%
1 ene 2005 año
3.034
-0.765
-20.14%
1 ene 2006 año
2.832
-0.202
-6.67%
1 ene 2007 año
2.536
-0.296
-10.44%
1 ene 2008 año
2.416
-0.121
-4.75%
1 ene 2009 año
2.776
+0.361
14.93%
1 ene 2010 año
1.122
-1.655
-59.6%
1 ene 2011 año
1.787
+0.666
59.34%
1 ene 2012 año
1.975
+0.188
10.51%
1 ene 2013 año
1.6
-0.375
-18.98%
1 ene 2014 año
1.685
+0.085
5.34%
Ranking de los países por los datos estadísticos actuales


Comentarios: