29
/es/
es
AIzaSyAYiBZKx7MnpbEhh9jyipgxe19OcubqV5w
April 1, 2024
153435
Iceland
ISL
true
2
1
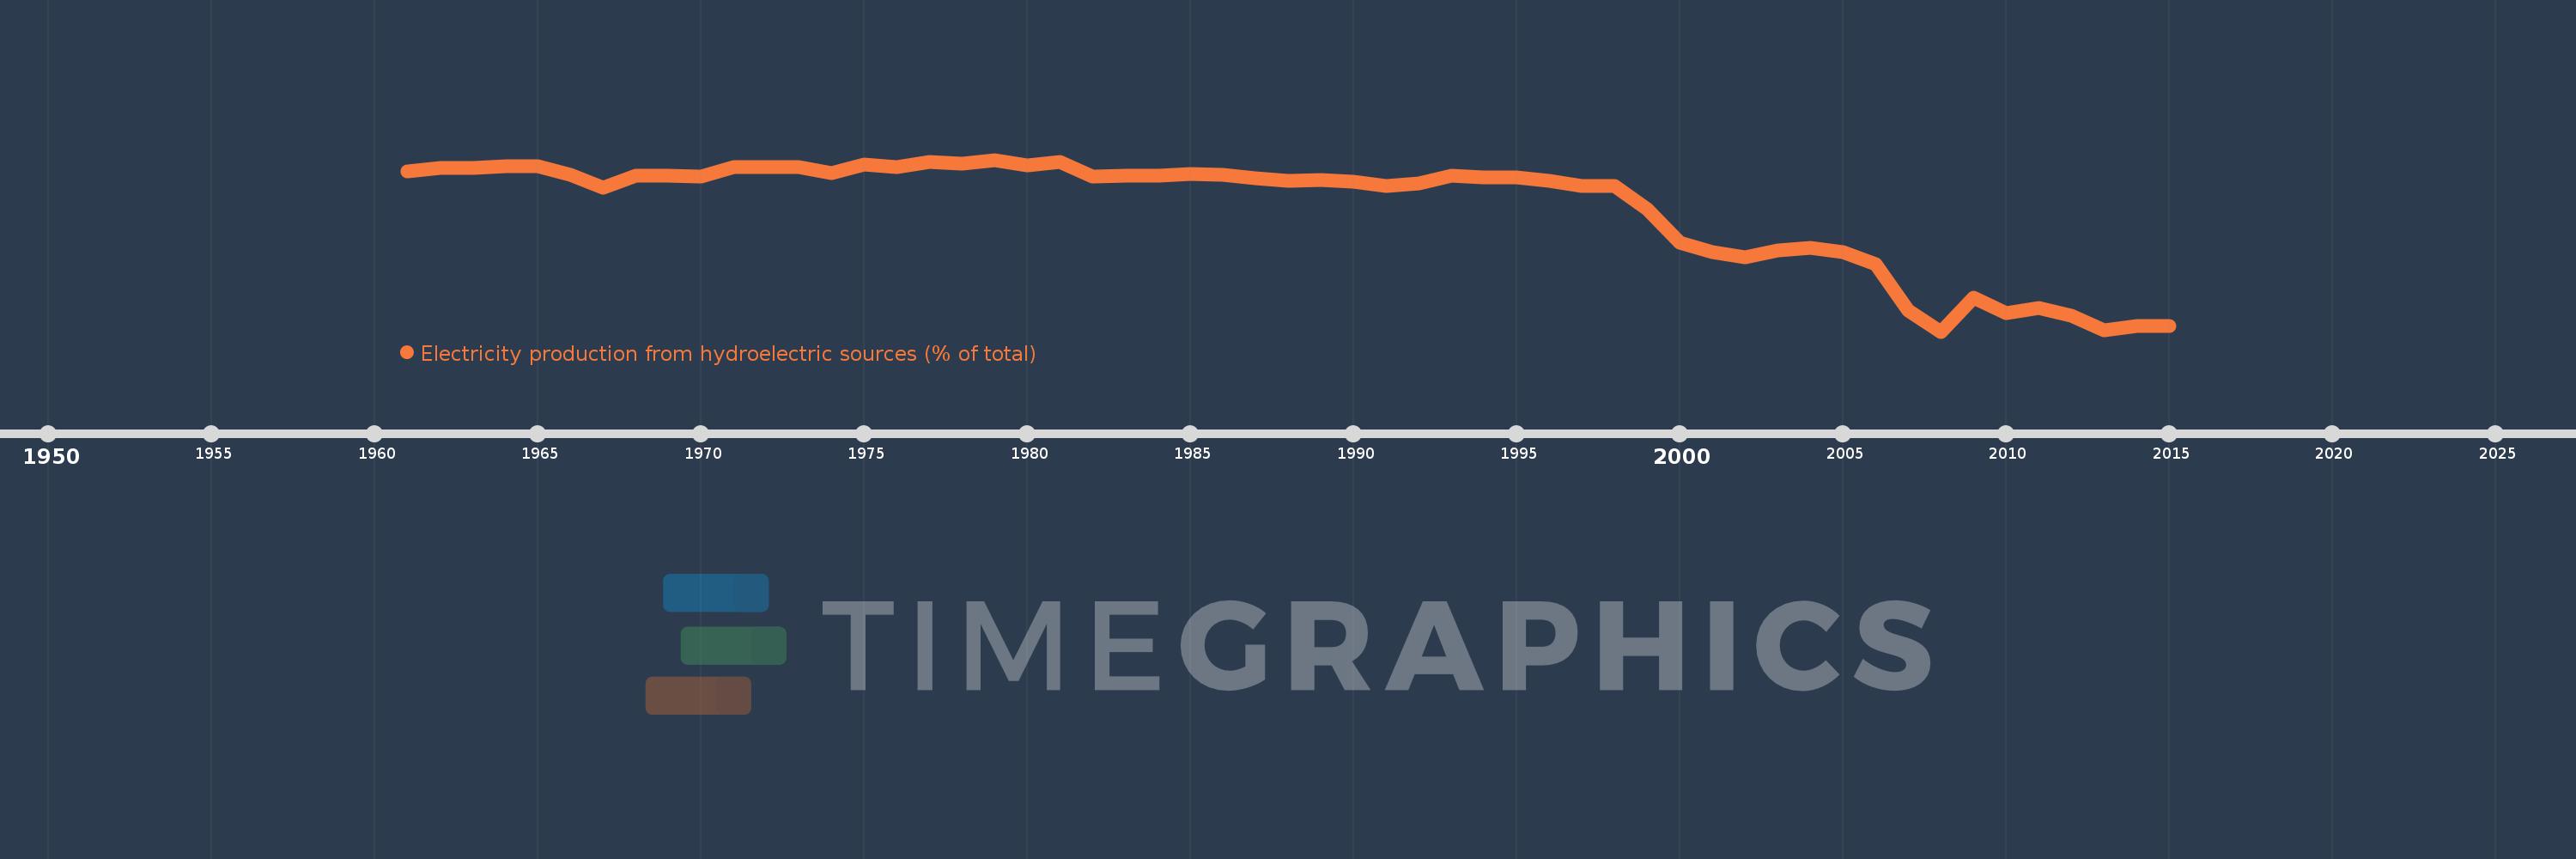
Electricity production from hydroelectric sources (% of total)
2015,2014,2013,2012,2011,2010,2009,2008,2007,2006,2005,2004,2003,2002,2001,2000,1999,1998,1997,1996,1995,1994,1993,1992,1991,1990,1989,1988,1987,1986,1985,1984,1983,1982,1981,1980,1979,1978,1977,1976,1975,1974,1973,1972,1971,1970,1969,1968,1967,1966,1965,1964,1963,1962,1961
Estas estadísticas en otros países:
AlbaniaAlgeriaAngolaArab WorldArgentinaArmeniaAustraliaAustriaAzerbaijanBahrainBangladeshBelarusBelgiumBeninBoliviaBosnia and HerzegovinaBotswanaBrazilBrunei DarussalamBulgariaCambodiaCameroonCanadaCentral Europe and the BalticsChileChinaColombiaCongo, Dem. Rep.Congo, Rep.Costa RicaCote d'IvoireCroatiaCubaCuracaoCyprusCzech RepublicDenmarkDominican RepublicEarly-demographic dividendEast Asia & PacificEast Asia & Pacific (excluding high income)East Asia & Pacific (IDA & IBRD countries)EcuadorEgypt, Arab Rep.El SalvadorEritreaEstoniaEthiopiaEuro areaEurope & Central AsiaEurope & Central Asia (excluding high income)Europe & Central Asia (IDA & IBRD countries)European UnionFinlandFragile and conflict affected situationsFranceGabonGeorgiaGermanyGhanaGibraltarGreeceGuatemalaHaitiHeavily indebted poor countries (HIPC)High incomeHondurasHong Kong SAR, ChinaHungaryIBRD onlyIcelandIDA & IBRD totalIDA blendIDA onlyIDA totalIndiaIndonesiaIran, Islamic Rep.IraqIrelandIsraelItalyJamaicaJapanJordanKazakhstanKenyaKorea, Dem. People’s Rep.Korea, Rep.KosovoKuwaitKyrgyz RepublicLate-demographic dividendLatin America & Caribbean Latin America & Caribbean (excluding high income)Latin America & the Caribbean (IDA & IBRD countries)LatviaLeast developed countries: UN classificationLebanonLibyaLithuaniaLow & middle incomeLower middle incomeLuxembourgMacedonia, FYRMalaysiaMaltaMauritiusMexicoMiddle East & North AfricaMiddle East & North Africa (excluding high income)Middle East & North Africa (IDA & IBRD countries)Middle incomeMoldovaMongoliaMontenegroMoroccoMozambiqueMyanmarNamibiaNepalNetherlandsNew ZealandNicaraguaNigerNigeriaNorth AmericaNorwayOECD membersOmanOther small statesPakistanPanamaParaguayPeruPhilippinesPolandPortugalPost-demographic dividendPre-demographic dividendQatarRomaniaRussian FederationSaudi ArabiaSenegalSerbiaSingaporeSlovak RepublicSloveniaSmall statesSouth AfricaSouth AsiaSouth Asia (IDA & IBRD)South SudanSpainSri LankaSub-Saharan Africa Sub-Saharan Africa (excluding high income)Sub-Saharan Africa (IDA & IBRD countries)SudanSwedenSwitzerlandSyrian Arab RepublicTajikistanTanzaniaThailandTogoTrinidad and TobagoTunisiaTurkeyTurkmenistanUkraineUnited Arab EmiratesUnited KingdomUnited StatesUpper middle incomeUruguayUzbekistanVenezuela, RBVietnamWorldYemen, Rep.ZambiaZimbabwe línea de tiempo (timeline):
En esta escala de tiempo se presenta un gráfico de 1961 y 2015 de Iceland. Los datos de 1960 están ausentes. El número de observaciones reales por fecha: 55.
Fuente (nombre):
Indicadores del desarrollo mundial
Fuente (organización):
IEA Statistics © OECD/IEA 2014 (http://www.iea.org/stats/index.asp), subject to https://www.iea.org/t&c/termsandconditions/
Categorías:
Energy & Mining, Climate Change, Infrastructure
Se ha actualizado:
23 abr 2017 año
Los indicadores de los cambios de valor en los últimos años
Mínimo:
70.084
1 ene 2008 año
Máximo:
97.303
1 ene 1979 año
A la fecha de observación
Valor
Cambio absoluto
El cambio con respecto al valor anterior
1 ene 1961 año
95.463
+95.463
0.0%
1 ene 1962 año
96.02
+0.557
0.58%
1 ene 1963 año
95.974
-0.046
-0.05%
1 ene 1964 año
96.341
+0.367
0.38%
1 ene 1965 año
96.329
-0.013
-0.01%
1 ene 1966 año
94.985
-1.344
-1.39%
1 ene 1967 año
92.92
-2.065
-2.17%
1 ene 1968 año
94.759
+1.839
1.98%
1 ene 1969 año
94.787
+0.028
0.03%
1 ene 1970 año
94.633
-0.154
-0.16%
1 ene 1971 año
96.169
+1.536
1.62%
1 ene 1972 año
96.175
+0.006
0.01%
1 ene 1973 año
96.098
-0.077
-0.08%
1 ene 1974 año
95.129
-0.969
-1.01%
1 ene 1975 año
96.577
+1.447
1.52%
1 ene 1976 año
96.083
-0.494
-0.51%
1 ene 1977 año
96.897
+0.814
0.85%
1 ene 1978 año
96.733
-0.164
-0.17%
1 ene 1979 año
97.303
+0.571
0.59%
1 ene 1980 año
96.447
-0.857
-0.88%
1 ene 1981 año
96.954
+0.507
0.53%
1 ene 1982 año
94.689
-2.265
-2.34%
1 ene 1983 año
94.825
+0.136
0.14%
1 ene 1984 año
94.775
-0.05
-0.05%
1 ene 1985 año
95.021
+0.246
0.26%
1 ene 1986 año
94.974
-0.047
-0.05%
1 ene 1987 año
94.409
-0.565
-0.59%
1 ene 1988 año
93.99
-0.419
-0.44%
1 ene 1989 año
94.038
+0.047
0.05%
1 ene 1990 año
93.873
-0.165
-0.18%
1 ene 1991 año
93.215
-0.658
-0.7%
1 ene 1992 año
93.547
+0.332
0.36%
1 ene 1993 año
94.809
+1.262
1.35%
1 ene 1994 año
94.479
-0.33
-0.35%
1 ene 1995 año
94.456
-0.022
-0.02%
1 ene 1996 año
93.997
-0.459
-0.49%
1 ene 1997 año
93.149
-0.849
-0.9%
1 ene 1998 año
93.215
+0.067
0.07%
1 ene 1999 año
89.492
-3.723
-3.99%
1 ene 2000 año
84.126
-5.366
-6.0%
1 ene 2001 año
82.717
-1.409
-1.67%
1 ene 2002 año
81.887
-0.83
-1.0%
1 ene 2003 año
82.902
+1.014
1.24%
1 ene 2004 año
83.388
+0.487
0.59%
1 ene 2005 año
82.732
-0.656
-0.79%
1 ene 2006 año
80.808
-1.924
-2.33%
1 ene 2007 año
73.444
-7.364
-9.11%
1 ene 2008 año
70.084
-3.36
-4.57%
1 ene 2009 año
75.466
+5.382
7.68%
1 ene 2010 año
72.942
-2.524
-3.35%
1 ene 2011 año
73.814
+0.873
1.2%
1 ene 2012 año
72.669
-1.146
-1.55%
1 ene 2013 año
70.3
-2.368
-3.26%
1 ene 2014 año
71.004
+0.703
1.0%
1 ene 2015 año
71.035
+0.032
0.04%
Ranking de los países por los datos estadísticos actuales


Comentarios: