29
/es/
es
AIzaSyAYiBZKx7MnpbEhh9jyipgxe19OcubqV5w
April 1, 2024
107119
Colombia
COL
true
2
1
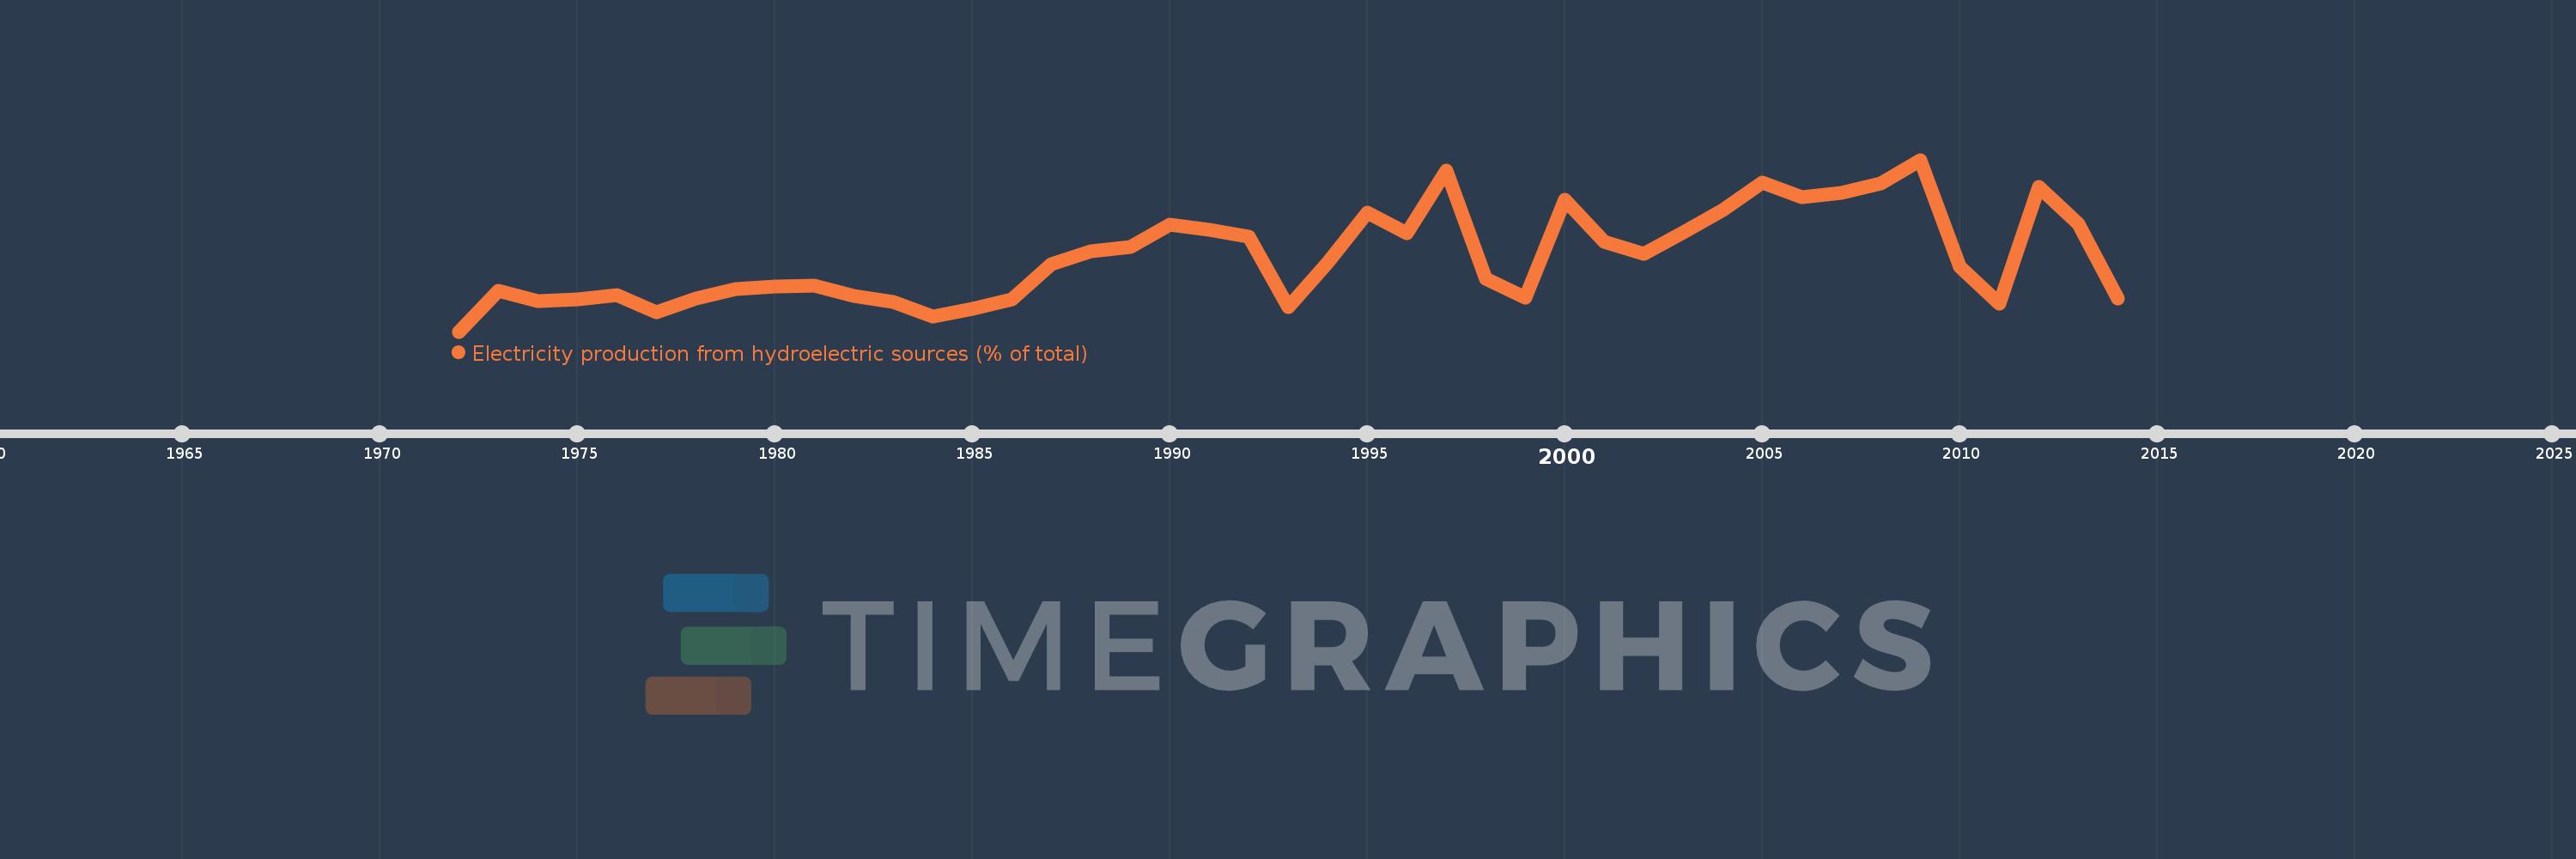
Electricity production from hydroelectric sources (% of total)
2014,2013,2012,2011,2010,2009,2008,2007,2006,2005,2004,2003,2002,2001,2000,1999,1998,1997,1996,1995,1994,1993,1992,1991,1990,1989,1988,1987,1986,1985,1984,1983,1982,1981,1980,1979,1978,1977,1976,1975,1974,1973,1972
Estas estadísticas en otros países:
AlbaniaAlgeriaAngolaArab WorldArgentinaArmeniaAustraliaAustriaAzerbaijanBahrainBangladeshBelarusBelgiumBeninBoliviaBosnia and HerzegovinaBotswanaBrazilBrunei DarussalamBulgariaCambodiaCameroonCanadaCentral Europe and the BalticsChileChinaColombiaCongo, Dem. Rep.Congo, Rep.Costa RicaCote d'IvoireCroatiaCubaCuracaoCyprusCzech RepublicDenmarkDominican RepublicEarly-demographic dividendEast Asia & PacificEast Asia & Pacific (excluding high income)East Asia & Pacific (IDA & IBRD countries)EcuadorEgypt, Arab Rep.El SalvadorEritreaEstoniaEthiopiaEuro areaEurope & Central AsiaEurope & Central Asia (excluding high income)Europe & Central Asia (IDA & IBRD countries)European UnionFinlandFragile and conflict affected situationsFranceGabonGeorgiaGermanyGhanaGibraltarGreeceGuatemalaHaitiHeavily indebted poor countries (HIPC)High incomeHondurasHong Kong SAR, ChinaHungaryIBRD onlyIcelandIDA & IBRD totalIDA blendIDA onlyIDA totalIndiaIndonesiaIran, Islamic Rep.IraqIrelandIsraelItalyJamaicaJapanJordanKazakhstanKenyaKorea, Dem. People’s Rep.Korea, Rep.KosovoKuwaitKyrgyz RepublicLate-demographic dividendLatin America & Caribbean Latin America & Caribbean (excluding high income)Latin America & the Caribbean (IDA & IBRD countries)LatviaLeast developed countries: UN classificationLebanonLibyaLithuaniaLow & middle incomeLower middle incomeLuxembourgMacedonia, FYRMalaysiaMaltaMauritiusMexicoMiddle East & North AfricaMiddle East & North Africa (excluding high income)Middle East & North Africa (IDA & IBRD countries)Middle incomeMoldovaMongoliaMontenegroMoroccoMozambiqueMyanmarNamibiaNepalNetherlandsNew ZealandNicaraguaNigerNigeriaNorth AmericaNorwayOECD membersOmanOther small statesPakistanPanamaParaguayPeruPhilippinesPolandPortugalPost-demographic dividendPre-demographic dividendQatarRomaniaRussian FederationSaudi ArabiaSenegalSerbiaSingaporeSlovak RepublicSloveniaSmall statesSouth AfricaSouth AsiaSouth Asia (IDA & IBRD)South SudanSpainSri LankaSub-Saharan Africa Sub-Saharan Africa (excluding high income)Sub-Saharan Africa (IDA & IBRD countries)SudanSwedenSwitzerlandSyrian Arab RepublicTajikistanTanzaniaThailandTogoTrinidad and TobagoTunisiaTurkeyTurkmenistanUkraineUnited Arab EmiratesUnited KingdomUnited StatesUpper middle incomeUruguayUzbekistanVenezuela, RBVietnamWorldYemen, Rep.ZambiaZimbabwe línea de tiempo (timeline):
En esta escala de tiempo se presenta un gráfico de 1972 y 2014 de Colombia. Los datos de 1971 están ausentes. El número de observaciones reales por fecha: 43.
Fuente (nombre):
Indicadores del desarrollo mundial
Fuente (organización):
IEA Statistics © OECD/IEA 2014 (http://www.iea.org/stats/index.asp), subject to https://www.iea.org/t&c/termsandconditions/
Categorías:
Energy & Mining, Climate Change, Infrastructure
Se ha actualizado:
23 abr 2017 año
Los indicadores de los cambios de valor en los últimos años
Mínimo:
65.062
1 ene 1972 año
Máximo:
82.954
1 ene 2009 año
A la fecha de observación
Valor
Cambio absoluto
El cambio con respecto al valor anterior
1 ene 1972 año
65.062
+65.062
0.0%
1 ene 1973 año
69.326
+4.264
6.55%
1 ene 1974 año
68.281
-1.046
-1.51%
1 ene 1975 año
68.427
+0.146
0.21%
1 ene 1976 año
68.835
+0.407
0.6%
1 ene 1977 año
67.102
-1.733
-2.52%
1 ene 1978 año
68.513
+1.411
2.1%
1 ene 1979 año
69.516
+1.003
1.46%
1 ene 1980 año
69.771
+0.255
0.37%
1 ene 1981 año
69.867
+0.096
0.14%
1 ene 1982 año
68.783
-1.084
-1.55%
1 ene 1983 año
68.154
-0.628
-0.91%
1 ene 1984 año
66.632
-1.523
-2.23%
1 ene 1985 año
67.411
+0.78
1.17%
1 ene 1986 año
68.375
+0.964
1.43%
1 ene 1987 año
72.103
+3.728
5.45%
1 ene 1988 año
73.445
+1.342
1.86%
1 ene 1989 año
73.843
+0.398
0.54%
1 ene 1990 año
76.234
+2.391
3.24%
1 ene 1991 año
75.631
-0.603
-0.79%
1 ene 1992 año
74.955
-0.675
-0.89%
1 ene 1993 año
67.633
-7.322
-9.77%
1 ene 1994 año
72.245
+4.612
6.82%
1 ene 1995 año
77.42
+5.175
7.16%
1 ene 1996 año
75.288
-2.132
-2.75%
1 ene 1997 año
81.848
+6.56
8.71%
1 ene 1998 año
70.562
-11.287
-13.79%
1 ene 1999 año
68.561
-2.0
-2.83%
1 ene 2000 año
78.794
+10.232
14.92%
1 ene 2001 año
74.374
-4.419
-5.61%
1 ene 2002 año
73.196
-1.178
-1.58%
1 ene 2003 año
75.414
+2.218
3.03%
1 ene 2004 año
77.725
+2.311
3.06%
1 ene 2005 año
80.607
+2.882
3.71%
1 ene 2006 año
79.073
-1.534
-1.9%
1 ene 2007 año
79.498
+0.425
0.54%
1 ene 2008 año
80.481
+0.983
1.24%
1 ene 2009 año
82.954
+2.473
3.07%
1 ene 2010 año
71.83
-11.125
-13.41%
1 ene 2011 año
67.988
-3.842
-5.35%
1 ene 2012 año
80.121
+12.134
17.85%
1 ene 2013 año
76.33
-3.791
-4.73%
1 ene 2014 año
68.503
-7.827
-10.25%
Ranking de los países por los datos estadísticos actuales


Comentarios: