29
/es/
es
AIzaSyAYiBZKx7MnpbEhh9jyipgxe19OcubqV5w
April 1, 2024
51771
North America
NAC
false
2
1
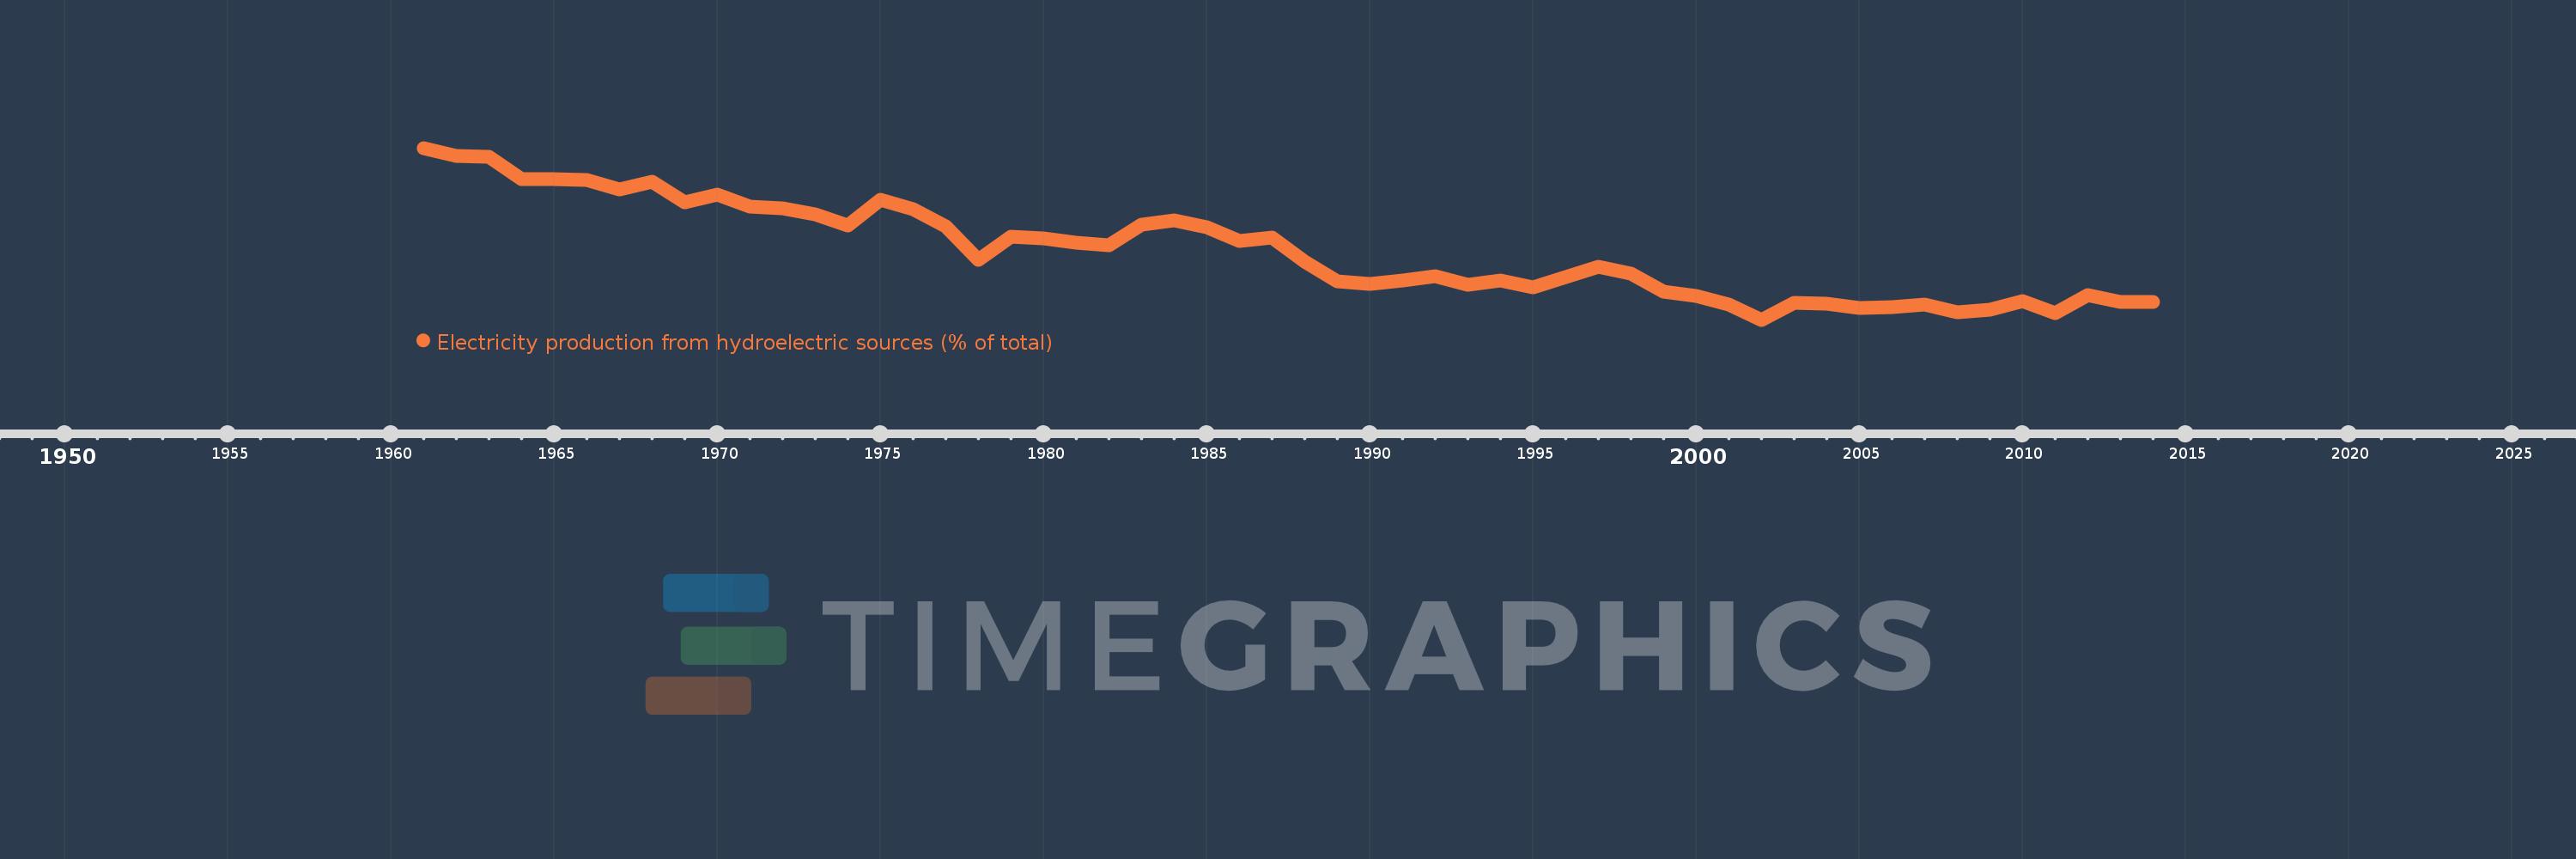
Electricity production from hydroelectric sources (% of total)
2014,2013,2012,2011,2010,2009,2008,2007,2006,2005,2004,2003,2002,2001,2000,1999,1998,1997,1996,1995,1994,1993,1992,1991,1990,1989,1988,1987,1986,1985,1984,1983,1982,1981,1980,1979,1978,1977,1976,1975,1974,1973,1972,1971,1970,1969,1968,1967,1966,1965,1964,1963,1962,1961
Estas estadísticas en otros países:
AlbaniaAlgeriaAngolaArab WorldArgentinaArmeniaAustraliaAustriaAzerbaijanBahrainBangladeshBelarusBelgiumBeninBoliviaBosnia and HerzegovinaBotswanaBrazilBrunei DarussalamBulgariaCambodiaCameroonCanadaCentral Europe and the BalticsChileChinaColombiaCongo, Dem. Rep.Congo, Rep.Costa RicaCote d'IvoireCroatiaCubaCuracaoCyprusCzech RepublicDenmarkDominican RepublicEarly-demographic dividendEast Asia & PacificEast Asia & Pacific (excluding high income)East Asia & Pacific (IDA & IBRD countries)EcuadorEgypt, Arab Rep.El SalvadorEritreaEstoniaEthiopiaEuro areaEurope & Central AsiaEurope & Central Asia (excluding high income)Europe & Central Asia (IDA & IBRD countries)European UnionFinlandFragile and conflict affected situationsFranceGabonGeorgiaGermanyGhanaGibraltarGreeceGuatemalaHaitiHeavily indebted poor countries (HIPC)High incomeHondurasHong Kong SAR, ChinaHungaryIBRD onlyIcelandIDA & IBRD totalIDA blendIDA onlyIDA totalIndiaIndonesiaIran, Islamic Rep.IraqIrelandIsraelItalyJamaicaJapanJordanKazakhstanKenyaKorea, Dem. People’s Rep.Korea, Rep.KosovoKuwaitKyrgyz RepublicLate-demographic dividendLatin America & Caribbean Latin America & Caribbean (excluding high income)Latin America & the Caribbean (IDA & IBRD countries)LatviaLeast developed countries: UN classificationLebanonLibyaLithuaniaLow & middle incomeLower middle incomeLuxembourgMacedonia, FYRMalaysiaMaltaMauritiusMexicoMiddle East & North AfricaMiddle East & North Africa (excluding high income)Middle East & North Africa (IDA & IBRD countries)Middle incomeMoldovaMongoliaMontenegroMoroccoMozambiqueMyanmarNamibiaNepalNetherlandsNew ZealandNicaraguaNigerNigeriaNorth AmericaNorwayOECD membersOmanOther small statesPakistanPanamaParaguayPeruPhilippinesPolandPortugalPost-demographic dividendPre-demographic dividendQatarRomaniaRussian FederationSaudi ArabiaSenegalSerbiaSingaporeSlovak RepublicSloveniaSmall statesSouth AfricaSouth AsiaSouth Asia (IDA & IBRD)South SudanSpainSri LankaSub-Saharan Africa Sub-Saharan Africa (excluding high income)Sub-Saharan Africa (IDA & IBRD countries)SudanSwedenSwitzerlandSyrian Arab RepublicTajikistanTanzaniaThailandTogoTrinidad and TobagoTunisiaTurkeyTurkmenistanUkraineUnited Arab EmiratesUnited KingdomUnited StatesUpper middle incomeUruguayUzbekistanVenezuela, RBVietnamWorldYemen, Rep.ZambiaZimbabwe línea de tiempo (timeline):
En esta escala de tiempo se presenta un gráfico de 1961 y 2014 de North America. Los datos de 1960 están ausentes. El número de observaciones reales por fecha: 54.
Fuente (nombre):
Indicadores del desarrollo mundial
Fuente (organización):
IEA Statistics © OECD/IEA 2014 (http://www.iea.org/stats/index.asp), subject to https://www.iea.org/t&c/termsandconditions/
Categorías:
Energy & Mining, Climate Change, Infrastructure
Se ha actualizado:
23 abr 2017 año
Los indicadores de los cambios de valor en los últimos años
Mínimo:
11.772
1 ene 2002 año
Máximo:
27.756
1 ene 1961 año
A la fecha de observación
Valor
Cambio absoluto
El cambio con respecto al valor anterior
1 ene 1961 año
27.756
+27.756
0.0%
1 ene 1962 año
27.024
-0.731
-2.63%
1 ene 1963 año
26.925
-0.099
-0.37%
1 ene 1964 año
24.845
-2.08
-7.73%
1 ene 1965 año
24.845
0.0
0.0%
1 ene 1966 año
24.807
-0.037
-0.15%
1 ene 1967 año
23.869
-0.938
-3.78%
1 ene 1968 año
24.618
+0.749
3.14%
1 ene 1969 año
22.685
-1.933
-7.85%
1 ene 1970 año
23.389
+0.704
3.1%
1 ene 1971 año
22.278
-1.111
-4.75%
1 ene 1972 año
22.116
-0.162
-0.73%
1 ene 1973 año
21.573
-0.543
-2.45%
1 ene 1974 año
20.569
-1.004
-4.65%
1 ene 1975 año
22.961
+2.392
11.63%
1 ene 1976 año
22.084
-0.877
-3.82%
1 ene 1977 año
20.484
-1.6
-7.25%
1 ene 1978 año
17.326
-3.157
-15.41%
1 ene 1979 año
19.488
+2.162
12.48%
1 ene 1980 año
19.364
-0.124
-0.63%
1 ene 1981 año
18.914
-0.451
-2.33%
1 ene 1982 año
18.712
-0.202
-1.07%
1 ene 1983 año
20.617
+1.905
10.18%
1 ene 1984 año
21.042
+0.425
2.06%
1 ene 1985 año
20.342
-0.7
-3.33%
1 ene 1986 año
19.065
-1.277
-6.28%
1 ene 1987 año
19.437
+0.372
1.95%
1 ene 1988 año
17.203
-2.233
-11.49%
1 ene 1989 año
15.328
-1.875
-10.9%
1 ene 1990 año
15.087
-0.241
-1.57%
1 ene 1991 año
15.459
+0.372
2.46%
1 ene 1992 año
15.843
+0.384
2.48%
1 ene 1993 año
15.049
-0.793
-5.01%
1 ene 1994 año
15.46
+0.411
2.73%
1 ene 1995 año
14.781
-0.679
-4.39%
1 ene 1996 año
15.777
+0.996
6.74%
1 ene 1997 año
16.72
+0.943
5.97%
1 ene 1998 año
16.1
-0.62
-3.71%
1 ene 1999 año
14.377
-1.723
-10.7%
1 ene 2000 año
14.001
-0.376
-2.61%
1 ene 2001 año
13.202
-0.799
-5.71%
1 ene 2002 año
11.772
-1.43
-10.83%
1 ene 2003 año
13.34
+1.568
13.32%
1 ene 2004 año
13.259
-0.081
-0.61%
1 ene 2005 año
12.883
-0.376
-2.84%
1 ene 2006 año
12.957
+0.073
0.57%
1 ene 2007 año
13.191
+0.234
1.81%
1 ene 2008 año
12.455
-0.736
-5.58%
1 ene 2009 año
12.742
+0.286
2.3%
1 ene 2010 año
13.488
+0.746
5.85%
1 ene 2011 año
12.383
-1.105
-8.19%
1 ene 2012 año
14.056
+1.673
13.51%
1 ene 2013 año
13.427
-0.629
-4.47%
1 ene 2014 año
13.411
-0.017
-0.12%
Ranking de los países por los datos estadísticos actuales


Comentarios: