29
/es/
es
AIzaSyAYiBZKx7MnpbEhh9jyipgxe19OcubqV5w
April 1, 2024
76416
Bahamas, The
BHS
true
2
1
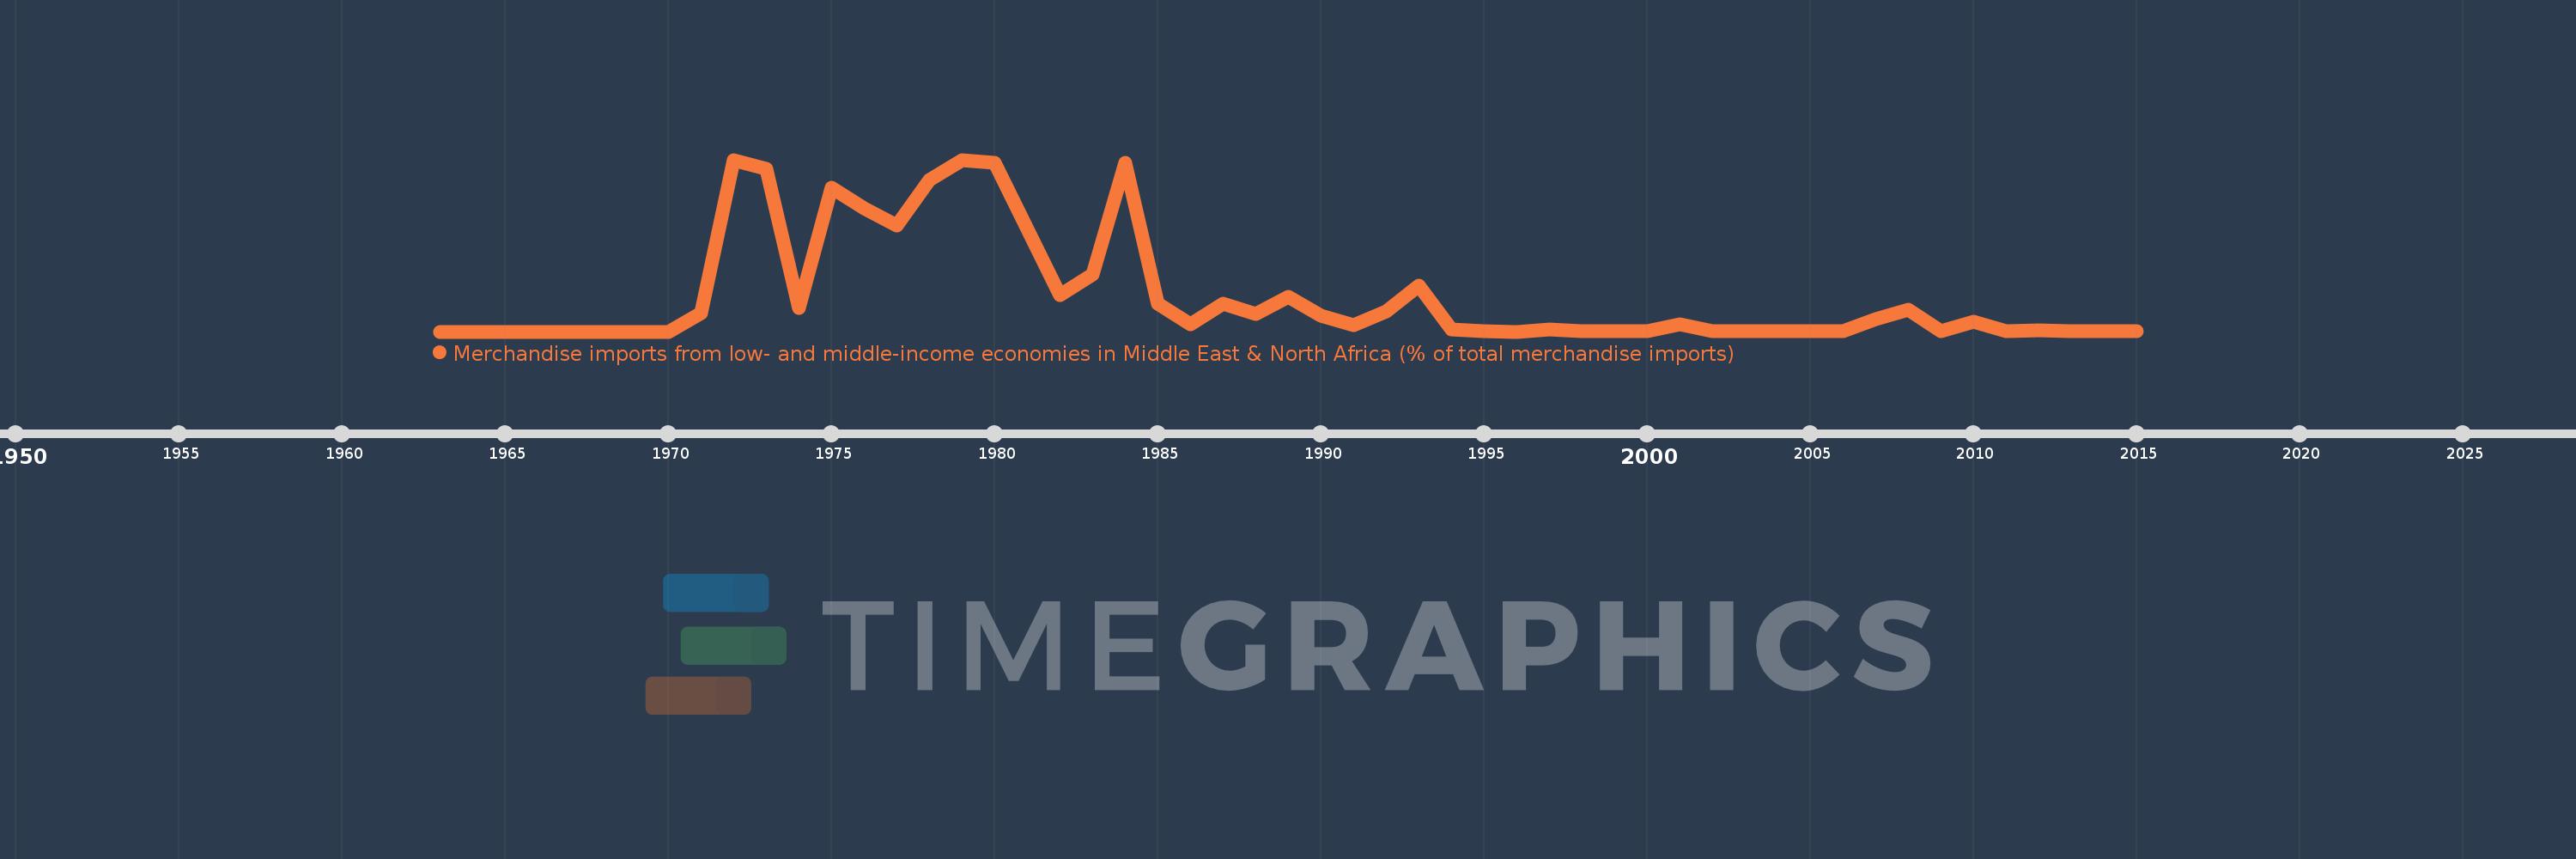
Merchandise imports from low- and middle-income economies in Middle East & North Africa (% of total merchandise imports)
2015,2014,2013,2012,2011,2010,2009,2008,2007,2006,2005,2004,2003,2002,2001,2000,1999,1998,1997,1996,1995,1994,1993,1992,1991,1990,1989,1988,1987,1986,1985,1984,1983,1982,1980,1979,1978,1977,1976,1975,1974,1973,1972,1971,1970,1969,1968,1967,1965,1964,1963
Estas estadísticas en otros países:
AfghanistanAlbaniaAlgeriaAngolaArab WorldArgentinaArmeniaArubaAustraliaAustriaAzerbaijanBahamas, TheBahrainBangladeshBarbadosBelarusBelgiumBelizeBeninBermudaBoliviaBosnia and HerzegovinaBrazilBrunei DarussalamBulgariaBurkina FasoBurundiCabo VerdeCambodiaCameroonCanadaCaribbean small statesCentral African RepublicCentral Europe and the BalticsChadChileChinaColombiaComorosCongo, Dem. Rep.Congo, Rep.Costa RicaCote d'IvoireCroatiaCubaCyprusCzech RepublicDenmarkDjiboutiDominicaDominican RepublicEarly-demographic dividendEast Asia & PacificEast Asia & Pacific (excluding high income)East Asia & Pacific (IDA & IBRD countries)EcuadorEgypt, Arab Rep.El SalvadorEstoniaEthiopiaEuro areaEurope & Central AsiaEurope & Central Asia (excluding high income)Europe & Central Asia (IDA & IBRD countries)European UnionFijiFinlandFragile and conflict affected situationsFranceFrench PolynesiaGabonGambia, TheGeorgiaGermanyGhanaGreeceGreenlandGrenadaGuatemalaGuineaGuinea-BissauGuyanaHaitiHeavily indebted poor countries (HIPC)High incomeHondurasHong Kong SAR, ChinaHungaryIBRD onlyIcelandIDA & IBRD totalIDA blendIDA onlyIDA totalIndiaIndonesiaIran, Islamic Rep.IraqIrelandIsraelItalyJamaicaJapanJordanKazakhstanKenyaKorea, Dem. People’s Rep.Korea, Rep.KosovoKuwaitKyrgyz RepublicLao PDRLate-demographic dividendLatin America & Caribbean Latin America & Caribbean (excluding high income)Latin America & the Caribbean (IDA & IBRD countries)LatviaLeast developed countries: UN classificationLebanonLiberiaLibyaLithuaniaLow & middle incomeLow incomeLower middle incomeLuxembourgMacao SAR, ChinaMacedonia, FYRMadagascarMalawiMalaysiaMaldivesMaliMaltaMauritaniaMauritiusMexicoMiddle East & North AfricaMiddle East & North Africa (excluding high income)Middle East & North Africa (IDA & IBRD countries)Middle incomeMoldovaMongoliaMontenegroMoroccoMozambiqueMyanmarNepalNetherlandsNew CaledoniaNew ZealandNicaraguaNigerNigeriaNorth AmericaNorwayOECD membersOmanOther small statesPacific island small statesPakistanPanamaPapua New GuineaParaguayPeruPhilippinesPolandPortugalPost-demographic dividendPre-demographic dividendQatarRomaniaRussian FederationRwandaSamoaSaudi ArabiaSenegalSerbiaSeychellesSierra LeoneSingaporeSlovak RepublicSloveniaSmall statesSomaliaSouth AfricaSouth AsiaSouth Asia (IDA & IBRD)SpainSri LankaSt. Kitts and NevisSt. LuciaSt. Vincent and the GrenadinesSub-Saharan Africa Sub-Saharan Africa (excluding high income)Sub-Saharan Africa (IDA & IBRD countries)SudanSurinameSwedenSwitzerlandSyrian Arab RepublicTajikistanTanzaniaThailandTogoTrinidad and TobagoTunisiaTurkeyTurkmenistanUgandaUkraineUnited Arab EmiratesUnited KingdomUnited StatesUpper middle incomeUruguayUzbekistanVenezuela, RBVietnamWorldYemen, Rep.ZambiaZimbabwe línea de tiempo (timeline):
En esta escala de tiempo se presenta un gráfico de 1963 y 2015 de Bahamas, The. Los datos de 1962 están ausentes. El número de observaciones reales por fecha: 51.
Fuente (nombre):
Indicadores del desarrollo mundial
Fuente (organización):
World Bank staff estimates based data from International Monetary Fund's Direction of Trade database.
Categorías:
Private Sector, Trade
Se ha actualizado:
23 abr 2017 año
Los indicadores de los cambios de valor en los últimos años
Máximo:
26.924
1 ene 1979 año
A la fecha de observación
Valor
Cambio absoluto
El cambio con respecto al valor anterior
1 ene 1963 año
0.0
0.0
0.0%
1 ene 1971 año
2.892
+2.892
%
1 ene 1972 año
26.88
+23.988
829.52%
1 ene 1973 año
25.525
-1.355
-5.04%
1 ene 1974 año
3.637
-21.887
-85.75%
1 ene 1975 año
22.57
+18.932
520.49%
1 ene 1976 año
19.289
-3.281
-14.54%
1 ene 1977 año
16.578
-2.711
-14.06%
1 ene 1978 año
23.716
+7.139
43.06%
1 ene 1979 año
26.924
+3.207
13.52%
1 ene 1980 año
26.44
-0.484
-1.8%
1 ene 1982 año
5.757
-20.683
-78.23%
1 ene 1983 año
8.895
+3.139
54.52%
1 ene 1984 año
26.44
+17.544
197.23%
1 ene 1985 año
4.411
-22.028
-83.32%
1 ene 1986 año
1.111
-3.3
-74.82%
1 ene 1987 año
4.424
+3.313
298.25%
1 ene 1988 año
2.713
-1.711
-38.67%
1 ene 1989 año
5.42
+2.708
99.81%
1 ene 1990 año
2.526
-2.895
-53.4%
1 ene 1991 año
0.983
-1.542
-61.06%
1 ene 1992 año
3.221
+2.237
227.47%
1 ene 1993 año
7.142
+3.921
121.76%
1 ene 1994 año
0.37
-6.772
-94.82%
1 ene 1995 año
0.001
-0.369
-99.76%
1 ene 1996 año
0.0
0.0
-53.33%
1 ene 1997 año
0.278
+0.278
67.04 mil%
1 ene 1998 año
0.006
-0.273
-97.98%
1 ene 1999 año
0.006
+0.0
3.07%
1 ene 2000 año
0.002
-0.004
-61.02%
1 ene 2001 año
1.116
+1.114
49.38 mil%
1 ene 2002 año
0.003
-1.113
-99.74%
1 ene 2003 año
0.001
-0.002
-64.3%
1 ene 2004 año
0.001
0.0
-0.89%
1 ene 2005 año
0.119
+0.118
11.56 mil%
1 ene 2006 año
0.001
-0.118
-99.33%
1 ene 2007 año
1.946
+1.945
242.78 mil%
1 ene 2008 año
3.397
+1.452
74.62%
1 ene 2009 año
0.003
-3.394
-99.91%
1 ene 2010 año
1.538
+1.535
51.48 mil%
1 ene 2011 año
0.003
-1.535
-99.82%
1 ene 2012 año
0.262
+0.259
9.26 mil%
1 ene 2013 año
0.001
-0.261
-99.49%
1 ene 2014 año
0.002
+0.001
48.5%
1 ene 2015 año
0.003
+0.001
33.58%
Ranking de los países por los datos estadísticos actuales


Comentarios: