29
/es/
es
AIzaSyAYiBZKx7MnpbEhh9jyipgxe19OcubqV5w
April 1, 2024
102691
Central African Republic
CAF
true
2
1
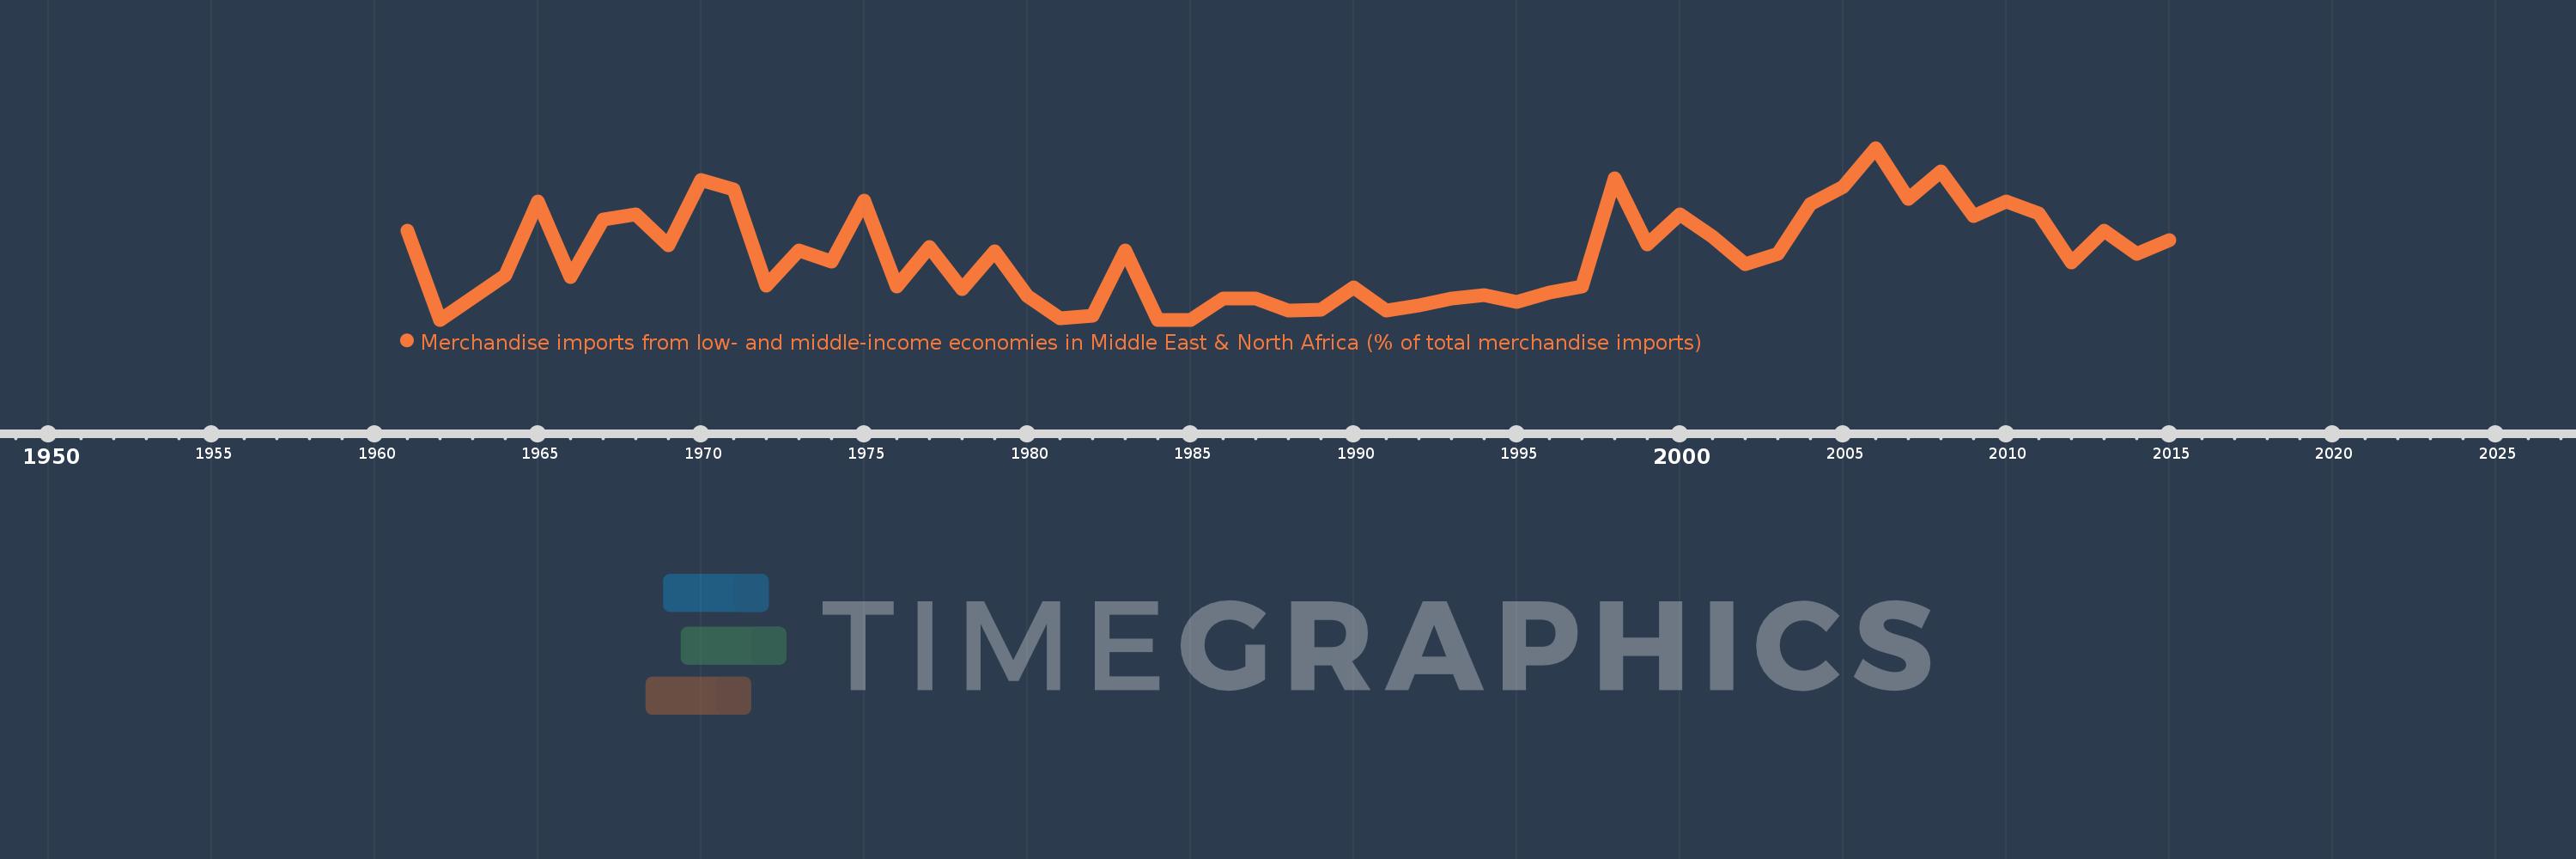
Merchandise imports from low- and middle-income economies in Middle East & North Africa (% of total merchandise imports)
2015,2014,2013,2012,2011,2010,2009,2008,2007,2006,2005,2004,2003,2002,2001,2000,1999,1998,1997,1996,1995,1994,1993,1992,1991,1990,1989,1988,1987,1986,1985,1984,1983,1982,1981,1980,1979,1978,1977,1976,1975,1974,1973,1972,1971,1970,1969,1968,1967,1966,1965,1964,1962,1961
Estas estadísticas en otros países:
AfghanistanAlbaniaAlgeriaAngolaArab WorldArgentinaArmeniaArubaAustraliaAustriaAzerbaijanBahamas, TheBahrainBangladeshBarbadosBelarusBelgiumBelizeBeninBermudaBoliviaBosnia and HerzegovinaBrazilBrunei DarussalamBulgariaBurkina FasoBurundiCabo VerdeCambodiaCameroonCanadaCaribbean small statesCentral African RepublicCentral Europe and the BalticsChadChileChinaColombiaComorosCongo, Dem. Rep.Congo, Rep.Costa RicaCote d'IvoireCroatiaCubaCyprusCzech RepublicDenmarkDjiboutiDominicaDominican RepublicEarly-demographic dividendEast Asia & PacificEast Asia & Pacific (excluding high income)East Asia & Pacific (IDA & IBRD countries)EcuadorEgypt, Arab Rep.El SalvadorEstoniaEthiopiaEuro areaEurope & Central AsiaEurope & Central Asia (excluding high income)Europe & Central Asia (IDA & IBRD countries)European UnionFijiFinlandFragile and conflict affected situationsFranceFrench PolynesiaGabonGambia, TheGeorgiaGermanyGhanaGreeceGreenlandGrenadaGuatemalaGuineaGuinea-BissauGuyanaHaitiHeavily indebted poor countries (HIPC)High incomeHondurasHong Kong SAR, ChinaHungaryIBRD onlyIcelandIDA & IBRD totalIDA blendIDA onlyIDA totalIndiaIndonesiaIran, Islamic Rep.IraqIrelandIsraelItalyJamaicaJapanJordanKazakhstanKenyaKorea, Dem. People’s Rep.Korea, Rep.KosovoKuwaitKyrgyz RepublicLao PDRLate-demographic dividendLatin America & Caribbean Latin America & Caribbean (excluding high income)Latin America & the Caribbean (IDA & IBRD countries)LatviaLeast developed countries: UN classificationLebanonLiberiaLibyaLithuaniaLow & middle incomeLow incomeLower middle incomeLuxembourgMacao SAR, ChinaMacedonia, FYRMadagascarMalawiMalaysiaMaldivesMaliMaltaMauritaniaMauritiusMexicoMiddle East & North AfricaMiddle East & North Africa (excluding high income)Middle East & North Africa (IDA & IBRD countries)Middle incomeMoldovaMongoliaMontenegroMoroccoMozambiqueMyanmarNepalNetherlandsNew CaledoniaNew ZealandNicaraguaNigerNigeriaNorth AmericaNorwayOECD membersOmanOther small statesPacific island small statesPakistanPanamaPapua New GuineaParaguayPeruPhilippinesPolandPortugalPost-demographic dividendPre-demographic dividendQatarRomaniaRussian FederationRwandaSamoaSaudi ArabiaSenegalSerbiaSeychellesSierra LeoneSingaporeSlovak RepublicSloveniaSmall statesSomaliaSouth AfricaSouth AsiaSouth Asia (IDA & IBRD)SpainSri LankaSt. Kitts and NevisSt. LuciaSt. Vincent and the GrenadinesSub-Saharan Africa Sub-Saharan Africa (excluding high income)Sub-Saharan Africa (IDA & IBRD countries)SudanSurinameSwedenSwitzerlandSyrian Arab RepublicTajikistanTanzaniaThailandTogoTrinidad and TobagoTunisiaTurkeyTurkmenistanUgandaUkraineUnited Arab EmiratesUnited KingdomUnited StatesUpper middle incomeUruguayUzbekistanVenezuela, RBVietnamWorldYemen, Rep.ZambiaZimbabwe línea de tiempo (timeline):
En esta escala de tiempo se presenta un gráfico de 1961 y 2015 de Central African Republic. Los datos de 1960 están ausentes. El número de observaciones reales por fecha: 54.
Fuente (nombre):
Indicadores del desarrollo mundial
Fuente (organización):
World Bank staff estimates based data from International Monetary Fund's Direction of Trade database.
Categorías:
Private Sector, Trade
Se ha actualizado:
23 abr 2017 año
Los indicadores de los cambios de valor en los últimos años
Máximo:
2.96
1 ene 2006 año
A la fecha de observación
Valor
Cambio absoluto
El cambio con respecto al valor anterior
1 ene 1961 año
1.531
+1.531
0.0%
1 ene 1962 año
0.0
-1.531
-100.0%
1 ene 1964 año
0.758
+0.758
%
1 ene 1965 año
2.034
+1.276
168.47%
1 ene 1966 año
0.735
-1.299
-63.85%
1 ene 1967 año
1.724
+0.989
134.48%
1 ene 1968 año
1.822
+0.098
5.69%
1 ene 1969 año
1.289
-0.534
-29.28%
1 ene 1970 año
2.407
+1.118
86.74%
1 ene 1971 año
2.249
-0.157
-6.54%
1 ene 1972 año
0.584
-1.665
-74.02%
1 ene 1973 año
1.19
+0.606
103.65%
1 ene 1974 año
0.997
-0.193
-16.21%
1 ene 1975 año
2.05
+1.053
105.61%
1 ene 1976 año
0.573
-1.477
-72.06%
1 ene 1977 año
1.26
+0.687
119.89%
1 ene 1978 año
0.533
-0.727
-57.72%
1 ene 1979 año
1.186
+0.654
122.66%
1 ene 1980 año
0.409
-0.777
-65.49%
1 ene 1981 año
0.024
-0.385
-94.12%
1 ene 1982 año
0.069
+0.045
185.93%
1 ene 1983 año
1.194
+1.125
1.64 mil%
1 ene 1984 año
0.0
-1.194
-100.0%
1 ene 1986 año
0.371
+0.371
%
1 ene 1987 año
0.371
0.0
0.0%
1 ene 1988 año
0.162
-0.209
-56.41%
1 ene 1989 año
0.17
+0.008
4.83%
1 ene 1990 año
0.553
+0.384
226.3%
1 ene 1991 año
0.161
-0.392
-70.88%
1 ene 1992 año
0.254
+0.093
57.75%
1 ene 1993 año
0.369
+0.114
44.99%
1 ene 1994 año
0.429
+0.061
16.53%
1 ene 1995 año
0.306
-0.123
-28.75%
1 ene 1996 año
0.472
+0.166
54.2%
1 ene 1997 año
0.578
+0.106
22.42%
1 ene 1998 año
2.435
+1.858
321.62%
1 ene 1999 año
1.294
-1.141
-46.86%
1 ene 2000 año
1.812
+0.518
40.03%
1 ene 2001 año
1.435
-0.377
-20.8%
1 ene 2002 año
0.952
-0.483
-33.64%
1 ene 2003 año
1.134
+0.182
19.12%
1 ene 2004 año
1.997
+0.862
76.02%
1 ene 2005 año
2.296
+0.299
14.97%
1 ene 2006 año
2.96
+0.664
28.94%
1 ene 2007 año
2.079
-0.881
-29.77%
1 ene 2008 año
2.557
+0.478
23.01%
1 ene 2009 año
1.785
-0.772
-30.18%
1 ene 2010 año
2.039
+0.253
14.19%
1 ene 2011 año
1.831
-0.208
-10.2%
1 ene 2012 año
0.993
-0.838
-45.78%
1 ene 2013 año
1.53
+0.537
54.1%
1 ene 2014 año
1.133
-0.396
-25.91%
1 ene 2015 año
1.366
+0.232
20.51%
Ranking de los países por los datos estadísticos actuales


Comentarios: