29
/es/
es
AIzaSyAYiBZKx7MnpbEhh9jyipgxe19OcubqV5w
April 1, 2024
68006
Angola
AGO
true
2
1
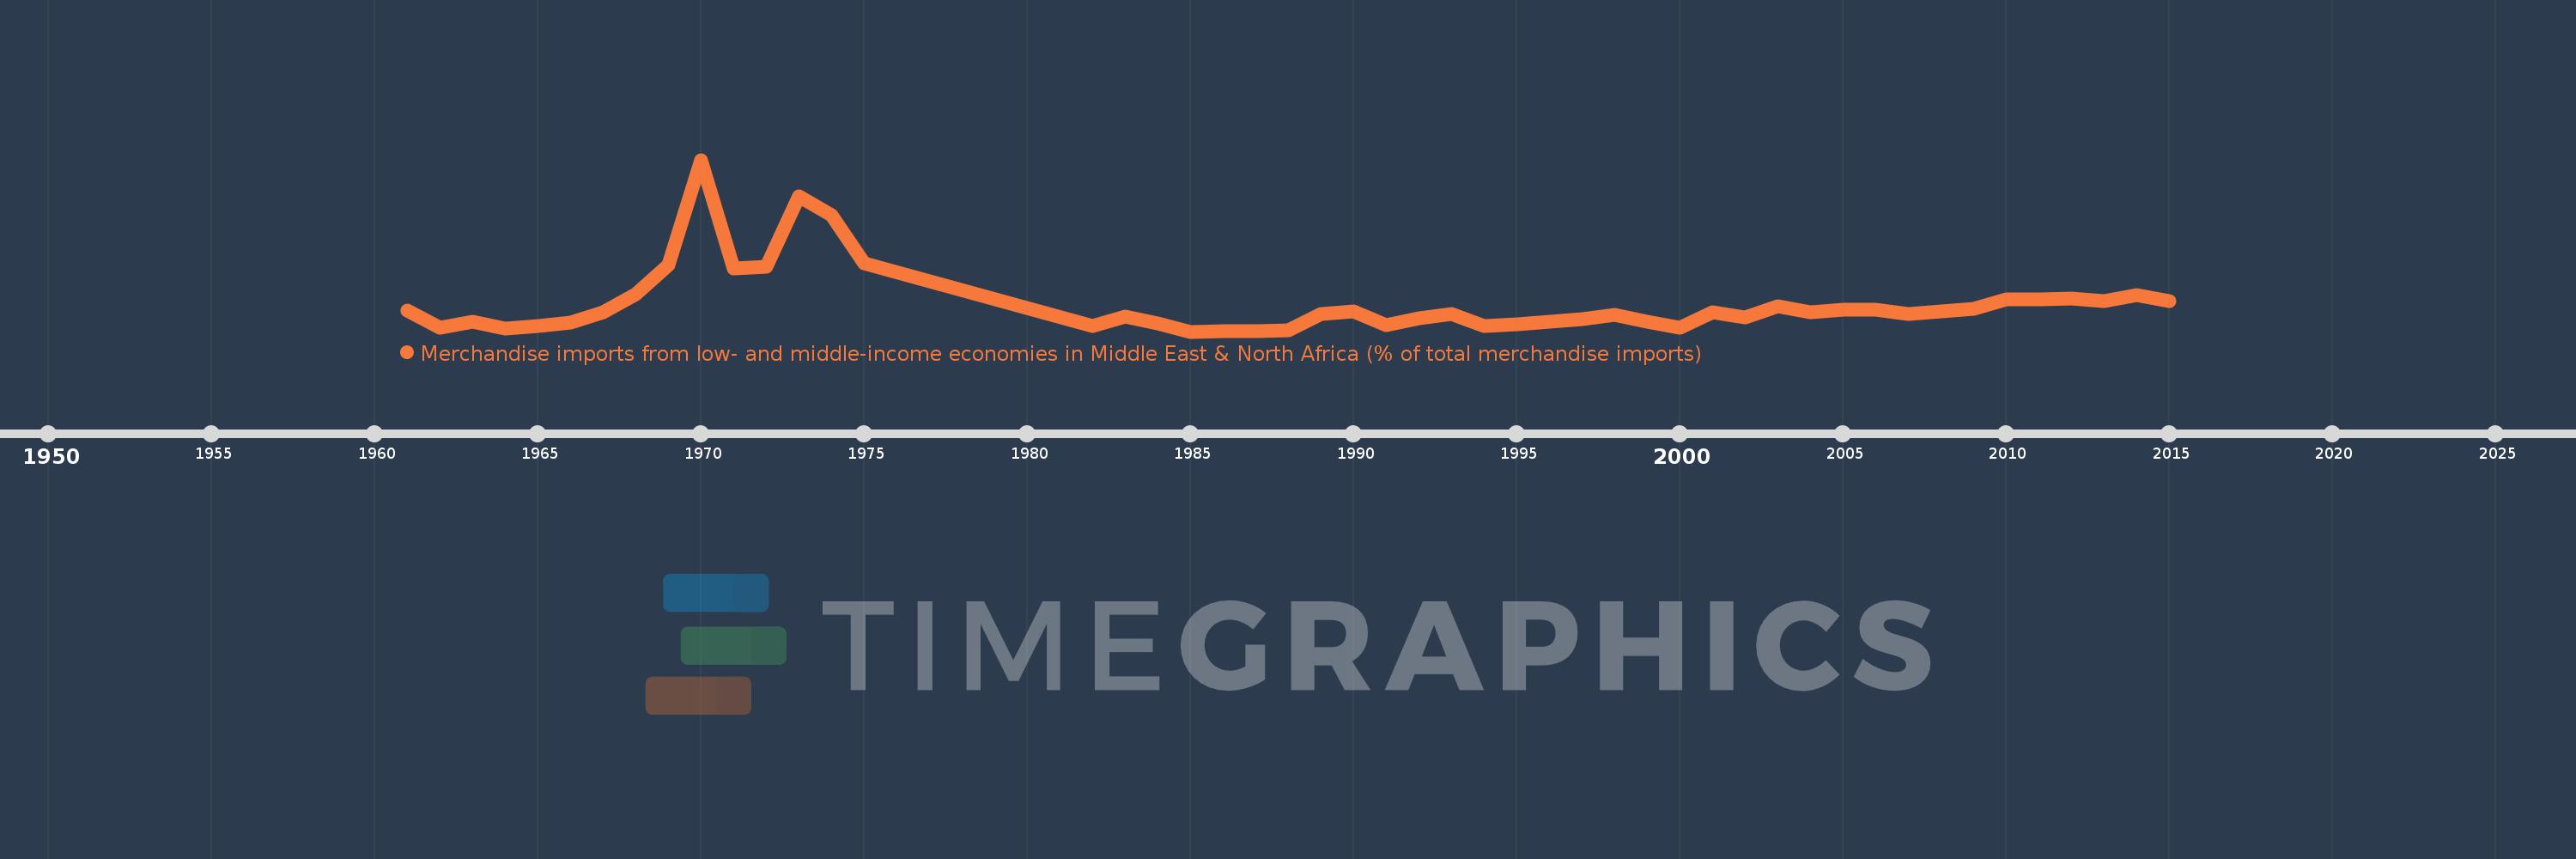
Merchandise imports from low- and middle-income economies in Middle East & North Africa (% of total merchandise imports)
2015,2014,2013,2012,2011,2010,2009,2008,2007,2006,2005,2004,2003,2002,2001,2000,1999,1998,1997,1996,1995,1994,1993,1992,1991,1990,1989,1988,1987,1986,1985,1984,1983,1982,1975,1974,1973,1972,1971,1970,1969,1968,1967,1966,1965,1964,1963,1962,1961
Estas estadísticas en otros países:
AfghanistanAlbaniaAlgeriaAngolaArab WorldArgentinaArmeniaArubaAustraliaAustriaAzerbaijanBahamas, TheBahrainBangladeshBarbadosBelarusBelgiumBelizeBeninBermudaBoliviaBosnia and HerzegovinaBrazilBrunei DarussalamBulgariaBurkina FasoBurundiCabo VerdeCambodiaCameroonCanadaCaribbean small statesCentral African RepublicCentral Europe and the BalticsChadChileChinaColombiaComorosCongo, Dem. Rep.Congo, Rep.Costa RicaCote d'IvoireCroatiaCubaCyprusCzech RepublicDenmarkDjiboutiDominicaDominican RepublicEarly-demographic dividendEast Asia & PacificEast Asia & Pacific (excluding high income)East Asia & Pacific (IDA & IBRD countries)EcuadorEgypt, Arab Rep.El SalvadorEstoniaEthiopiaEuro areaEurope & Central AsiaEurope & Central Asia (excluding high income)Europe & Central Asia (IDA & IBRD countries)European UnionFijiFinlandFragile and conflict affected situationsFranceFrench PolynesiaGabonGambia, TheGeorgiaGermanyGhanaGreeceGreenlandGrenadaGuatemalaGuineaGuinea-BissauGuyanaHaitiHeavily indebted poor countries (HIPC)High incomeHondurasHong Kong SAR, ChinaHungaryIBRD onlyIcelandIDA & IBRD totalIDA blendIDA onlyIDA totalIndiaIndonesiaIran, Islamic Rep.IraqIrelandIsraelItalyJamaicaJapanJordanKazakhstanKenyaKorea, Dem. People’s Rep.Korea, Rep.KosovoKuwaitKyrgyz RepublicLao PDRLate-demographic dividendLatin America & Caribbean Latin America & Caribbean (excluding high income)Latin America & the Caribbean (IDA & IBRD countries)LatviaLeast developed countries: UN classificationLebanonLiberiaLibyaLithuaniaLow & middle incomeLow incomeLower middle incomeLuxembourgMacao SAR, ChinaMacedonia, FYRMadagascarMalawiMalaysiaMaldivesMaliMaltaMauritaniaMauritiusMexicoMiddle East & North AfricaMiddle East & North Africa (excluding high income)Middle East & North Africa (IDA & IBRD countries)Middle incomeMoldovaMongoliaMontenegroMoroccoMozambiqueMyanmarNepalNetherlandsNew CaledoniaNew ZealandNicaraguaNigerNigeriaNorth AmericaNorwayOECD membersOmanOther small statesPacific island small statesPakistanPanamaPapua New GuineaParaguayPeruPhilippinesPolandPortugalPost-demographic dividendPre-demographic dividendQatarRomaniaRussian FederationRwandaSamoaSaudi ArabiaSenegalSerbiaSeychellesSierra LeoneSingaporeSlovak RepublicSloveniaSmall statesSomaliaSouth AfricaSouth AsiaSouth Asia (IDA & IBRD)SpainSri LankaSt. Kitts and NevisSt. LuciaSt. Vincent and the GrenadinesSub-Saharan Africa Sub-Saharan Africa (excluding high income)Sub-Saharan Africa (IDA & IBRD countries)SudanSurinameSwedenSwitzerlandSyrian Arab RepublicTajikistanTanzaniaThailandTogoTrinidad and TobagoTunisiaTurkeyTurkmenistanUgandaUkraineUnited Arab EmiratesUnited KingdomUnited StatesUpper middle incomeUruguayUzbekistanVenezuela, RBVietnamWorldYemen, Rep.ZambiaZimbabwe línea de tiempo (timeline):
En esta escala de tiempo se presenta un gráfico de 1961 y 2015 de Angola. Los datos de 1960 están ausentes. El número de observaciones reales por fecha: 49.
Fuente (nombre):
Indicadores del desarrollo mundial
Fuente (organización):
World Bank staff estimates based data from International Monetary Fund's Direction of Trade database.
Categorías:
Private Sector, Trade
Se ha actualizado:
23 abr 2017 año
Los indicadores de los cambios de valor en los últimos años
Máximo:
3.854
1 ene 1970 año
A la fecha de observación
Valor
Cambio absoluto
El cambio con respecto al valor anterior
1 ene 1961 año
0.471
+0.471
0.0%
1 ene 1962 año
0.088
-0.383
-81.29%
1 ene 1963 año
0.222
+0.134
152.26%
1 ene 1964 año
0.068
-0.154
-69.28%
1 ene 1965 año
0.122
+0.054
79.0%
1 ene 1966 año
0.205
+0.083
68.26%
1 ene 1967 año
0.432
+0.226
110.21%
1 ene 1968 año
0.838
+0.406
94.02%
1 ene 1969 año
1.493
+0.655
78.13%
1 ene 1970 año
3.854
+2.361
158.21%
1 ene 1971 año
1.41
-2.443
-63.4%
1 ene 1972 año
1.462
+0.052
3.65%
1 ene 1973 año
3.029
+1.567
107.15%
1 ene 1974 año
2.611
-0.418
-13.8%
1 ene 1975 año
1.527
-1.084
-41.51%
1 ene 1982 año
0.123
-1.405
-91.98%
1 ene 1983 año
0.345
+0.223
181.77%
1 ene 1984 año
0.174
-0.171
-49.46%
1 ene 1985 año
0.0
-0.174
-100.0%
1 ene 1986 año
0.002
+0.002
%
1 ene 1987 año
0.006
+0.005
304.4%
1 ene 1988 año
0.022
+0.016
251.16%
1 ene 1989 año
0.402
+0.38
1.73 mil%
1 ene 1990 año
0.451
+0.049
12.23%
1 ene 1991 año
0.137
-0.314
-69.71%
1 ene 1992 año
0.3
+0.163
119.67%
1 ene 1993 año
0.393
+0.093
31.1%
1 ene 1994 año
0.131
-0.262
-66.6%
1 ene 1995 año
0.158
+0.027
20.4%
1 ene 1996 año
0.214
+0.056
35.52%
1 ene 1997 año
0.284
+0.069
32.34%
1 ene 1998 año
0.374
+0.09
31.85%
1 ene 1999 año
0.22
-0.154
-41.1%
1 ene 2000 año
0.087
-0.133
-60.59%
1 ene 2001 año
0.442
+0.356
409.7%
1 ene 2002 año
0.312
-0.13
-29.48%
1 ene 2003 año
0.562
+0.25
80.12%
1 ene 2004 año
0.443
-0.12
-21.26%
1 ene 2005 año
0.497
+0.054
12.3%
1 ene 2006 año
0.482
-0.015
-2.93%
1 ene 2007 año
0.394
-0.089
-18.41%
1 ene 2008 año
0.452
+0.059
14.9%
1 ene 2009 año
0.515
+0.063
13.85%
1 ene 2010 año
0.716
+0.201
39.05%
1 ene 2011 año
0.717
+0.001
0.15%
1 ene 2012 año
0.743
+0.026
3.57%
1 ene 2013 año
0.692
-0.051
-6.81%
1 ene 2014 año
0.824
+0.132
19.11%
1 ene 2015 año
0.681
-0.144
-17.43%
Ranking de los países por los datos estadísticos actuales


Comentarios: