29
/es/
es
AIzaSyAYiBZKx7MnpbEhh9jyipgxe19OcubqV5w
April 1, 2024
36775
IBRD only
IBD
false
2
1
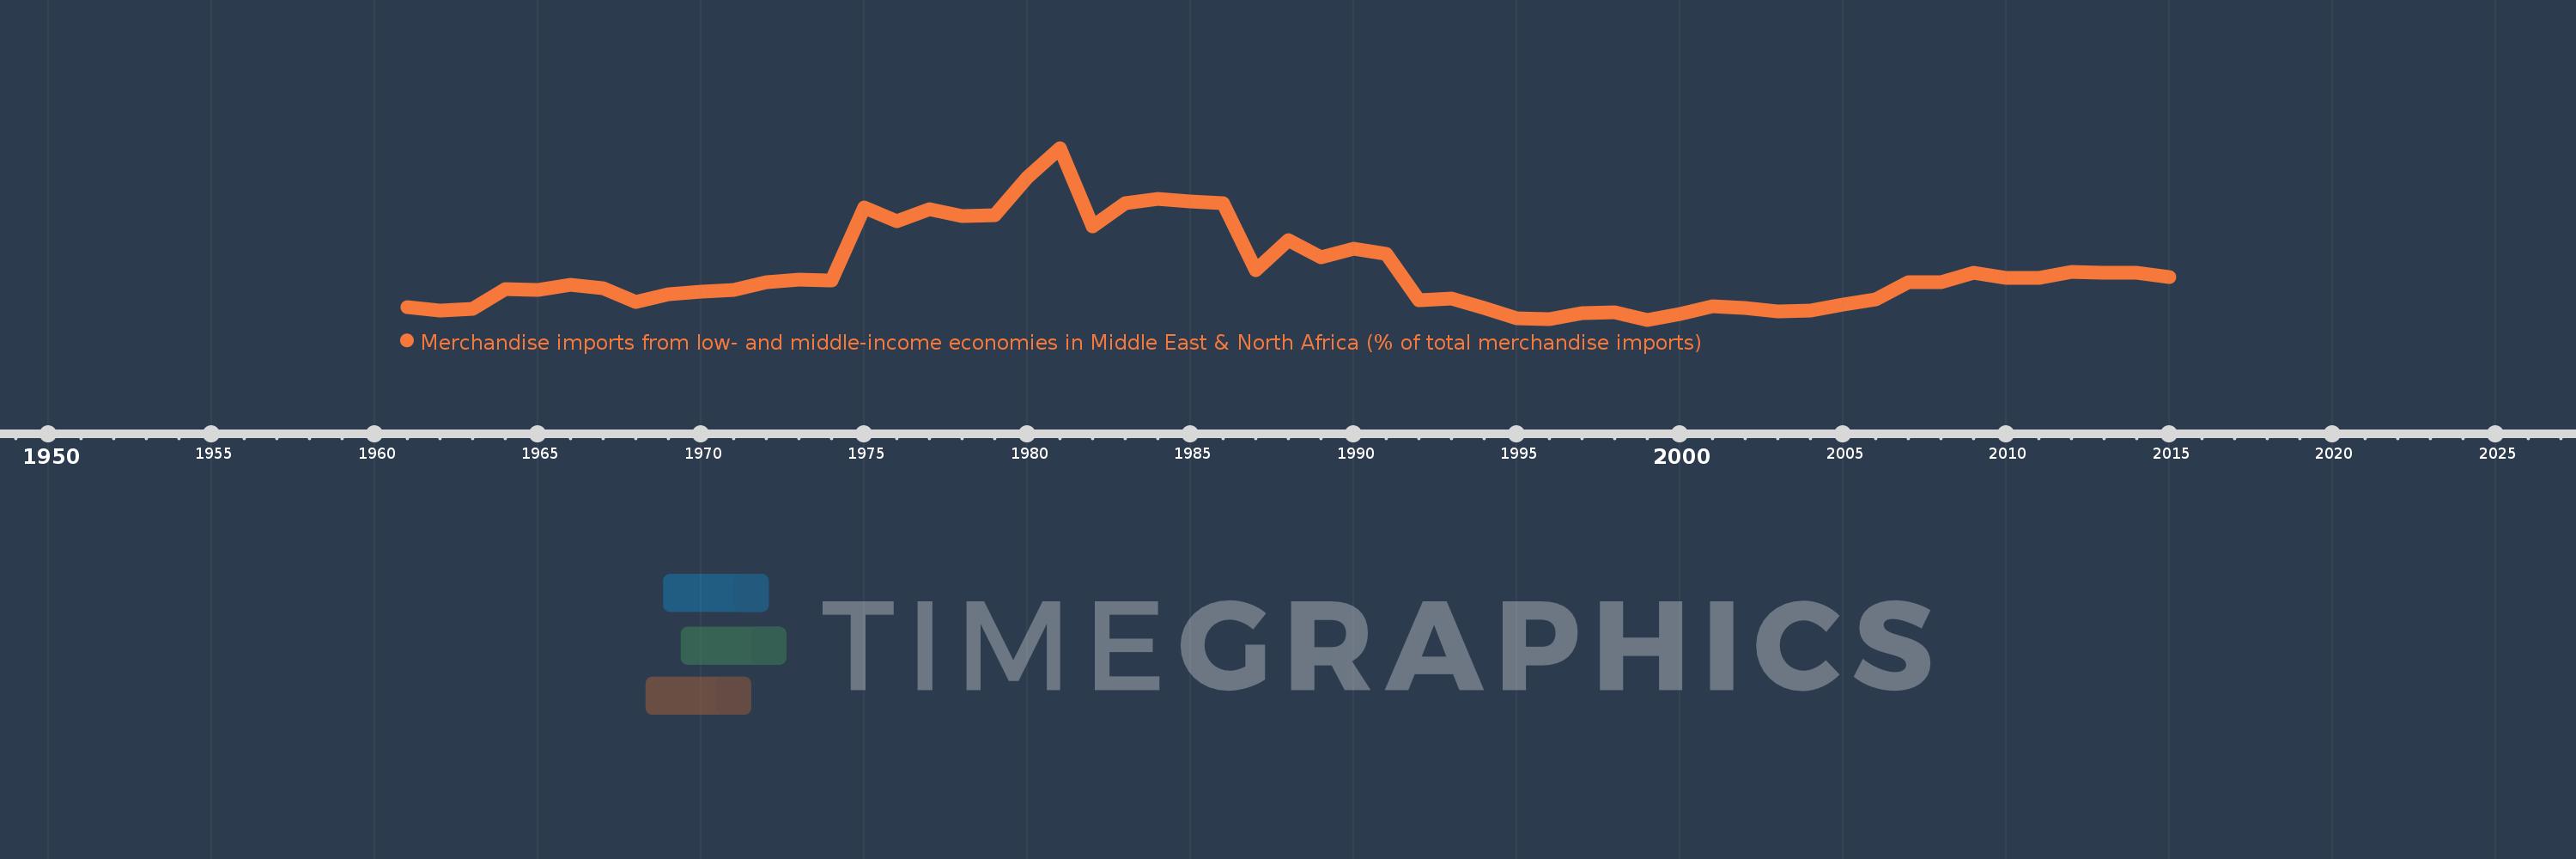
Merchandise imports from low- and middle-income economies in Middle East & North Africa (% of total merchandise imports)
2015,2014,2013,2012,2011,2010,2009,2008,2007,2006,2005,2004,2003,2002,2001,2000,1999,1998,1997,1996,1995,1994,1993,1992,1991,1990,1989,1988,1987,1986,1985,1984,1983,1982,1981,1980,1979,1978,1977,1976,1975,1974,1973,1972,1971,1970,1969,1968,1967,1966,1965,1964,1963,1962,1961
Estas estadísticas en otros países:
AfghanistanAlbaniaAlgeriaAngolaArab WorldArgentinaArmeniaArubaAustraliaAustriaAzerbaijanBahamas, TheBahrainBangladeshBarbadosBelarusBelgiumBelizeBeninBermudaBoliviaBosnia and HerzegovinaBrazilBrunei DarussalamBulgariaBurkina FasoBurundiCabo VerdeCambodiaCameroonCanadaCaribbean small statesCentral African RepublicCentral Europe and the BalticsChadChileChinaColombiaComorosCongo, Dem. Rep.Congo, Rep.Costa RicaCote d'IvoireCroatiaCubaCyprusCzech RepublicDenmarkDjiboutiDominicaDominican RepublicEarly-demographic dividendEast Asia & PacificEast Asia & Pacific (excluding high income)East Asia & Pacific (IDA & IBRD countries)EcuadorEgypt, Arab Rep.El SalvadorEstoniaEthiopiaEuro areaEurope & Central AsiaEurope & Central Asia (excluding high income)Europe & Central Asia (IDA & IBRD countries)European UnionFijiFinlandFragile and conflict affected situationsFranceFrench PolynesiaGabonGambia, TheGeorgiaGermanyGhanaGreeceGreenlandGrenadaGuatemalaGuineaGuinea-BissauGuyanaHaitiHeavily indebted poor countries (HIPC)High incomeHondurasHong Kong SAR, ChinaHungaryIBRD onlyIcelandIDA & IBRD totalIDA blendIDA onlyIDA totalIndiaIndonesiaIran, Islamic Rep.IraqIrelandIsraelItalyJamaicaJapanJordanKazakhstanKenyaKorea, Dem. People’s Rep.Korea, Rep.KosovoKuwaitKyrgyz RepublicLao PDRLate-demographic dividendLatin America & Caribbean Latin America & Caribbean (excluding high income)Latin America & the Caribbean (IDA & IBRD countries)LatviaLeast developed countries: UN classificationLebanonLiberiaLibyaLithuaniaLow & middle incomeLow incomeLower middle incomeLuxembourgMacao SAR, ChinaMacedonia, FYRMadagascarMalawiMalaysiaMaldivesMaliMaltaMauritaniaMauritiusMexicoMiddle East & North AfricaMiddle East & North Africa (excluding high income)Middle East & North Africa (IDA & IBRD countries)Middle incomeMoldovaMongoliaMontenegroMoroccoMozambiqueMyanmarNepalNetherlandsNew CaledoniaNew ZealandNicaraguaNigerNigeriaNorth AmericaNorwayOECD membersOmanOther small statesPacific island small statesPakistanPanamaPapua New GuineaParaguayPeruPhilippinesPolandPortugalPost-demographic dividendPre-demographic dividendQatarRomaniaRussian FederationRwandaSamoaSaudi ArabiaSenegalSerbiaSeychellesSierra LeoneSingaporeSlovak RepublicSloveniaSmall statesSomaliaSouth AfricaSouth AsiaSouth Asia (IDA & IBRD)SpainSri LankaSt. Kitts and NevisSt. LuciaSt. Vincent and the GrenadinesSub-Saharan Africa Sub-Saharan Africa (excluding high income)Sub-Saharan Africa (IDA & IBRD countries)SudanSurinameSwedenSwitzerlandSyrian Arab RepublicTajikistanTanzaniaThailandTogoTrinidad and TobagoTunisiaTurkeyTurkmenistanUgandaUkraineUnited Arab EmiratesUnited KingdomUnited StatesUpper middle incomeUruguayUzbekistanVenezuela, RBVietnamWorldYemen, Rep.ZambiaZimbabwe línea de tiempo (timeline):
En esta escala de tiempo se presenta un gráfico de 1961 y 2015 de IBRD only. Los datos de 1960 están ausentes. El número de observaciones reales por fecha: 55.
Fuente (nombre):
Indicadores del desarrollo mundial
Fuente (organización):
World Bank staff estimates based data from International Monetary Fund's Direction of Trade database.
Categorías:
Private Sector, Trade
Se ha actualizado:
23 abr 2017 año
Los indicadores de los cambios de valor en los últimos años
Mínimo:
1.326
1 ene 1999 año
Máximo:
6.382
1 ene 1981 año
A la fecha de observación
Valor
Cambio absoluto
El cambio con respecto al valor anterior
1 ene 1961 año
1.696
+1.696
0.0%
1 ene 1962 año
1.605
-0.091
-5.35%
1 ene 1963 año
1.652
+0.047
2.93%
1 ene 1964 año
2.23
+0.577
34.94%
1 ene 1965 año
2.196
-0.034
-1.52%
1 ene 1966 año
2.349
+0.153
6.96%
1 ene 1967 año
2.263
-0.085
-3.63%
1 ene 1968 año
1.861
-0.403
-17.79%
1 ene 1969 año
2.069
+0.208
11.21%
1 ene 1970 año
2.152
+0.083
4.03%
1 ene 1971 año
2.191
+0.039
1.81%
1 ene 1972 año
2.438
+0.247
11.27%
1 ene 1973 año
2.497
+0.059
2.4%
1 ene 1974 año
2.485
-0.012
-0.49%
1 ene 1975 año
4.636
+2.151
86.59%
1 ene 1976 año
4.222
-0.414
-8.93%
1 ene 1977 año
4.581
+0.359
8.5%
1 ene 1978 año
4.383
-0.198
-4.32%
1 ene 1979 año
4.391
+0.008
0.19%
1 ene 1980 año
5.516
+1.125
25.61%
1 ene 1981 año
6.382
+0.866
15.7%
1 ene 1982 año
4.067
-2.315
-36.27%
1 ene 1983 año
4.76
+0.693
17.05%
1 ene 1984 año
4.883
+0.123
2.58%
1 ene 1985 año
4.818
-0.065
-1.33%
1 ene 1986 año
4.747
-0.071
-1.48%
1 ene 1987 año
2.786
-1.961
-41.32%
1 ene 1988 año
3.663
+0.878
31.51%
1 ene 1989 año
3.169
-0.494
-13.49%
1 ene 1990 año
3.41
+0.241
7.59%
1 ene 1991 año
3.264
-0.145
-4.26%
1 ene 1992 año
1.891
-1.374
-42.07%
1 ene 1993 año
1.961
+0.07
3.69%
1 ene 1994 año
1.665
-0.296
-15.1%
1 ene 1995 año
1.368
-0.297
-17.84%
1 ene 1996 año
1.342
-0.025
-1.84%
1 ene 1997 año
1.522
+0.179
13.36%
1 ene 1998 año
1.537
+0.015
0.98%
1 ene 1999 año
1.326
-0.21
-13.7%
1 ene 2000 año
1.493
+0.167
12.61%
1 ene 2001 año
1.724
+0.231
15.45%
1 ene 2002 año
1.671
-0.053
-3.1%
1 ene 2003 año
1.574
-0.097
-5.79%
1 ene 2004 año
1.604
+0.03
1.91%
1 ene 2005 año
1.761
+0.157
9.79%
1 ene 2006 año
1.917
+0.155
8.83%
1 ene 2007 año
2.438
+0.521
27.18%
1 ene 2008 año
2.422
-0.015
-0.62%
1 ene 2009 año
2.718
+0.296
12.2%
1 ene 2010 año
2.552
-0.166
-6.12%
1 ene 2011 año
2.548
-0.004
-0.15%
1 ene 2012 año
2.723
+0.175
6.87%
1 ene 2013 año
2.709
-0.014
-0.51%
1 ene 2014 año
2.713
+0.004
0.15%
1 ene 2015 año
2.589
-0.124
-4.57%
Ranking de los países por los datos estadísticos actuales


Comentarios: