29
/es/
es
AIzaSyAYiBZKx7MnpbEhh9jyipgxe19OcubqV5w
April 1, 2024
75304
Azerbaijan
AZE
true
2
1
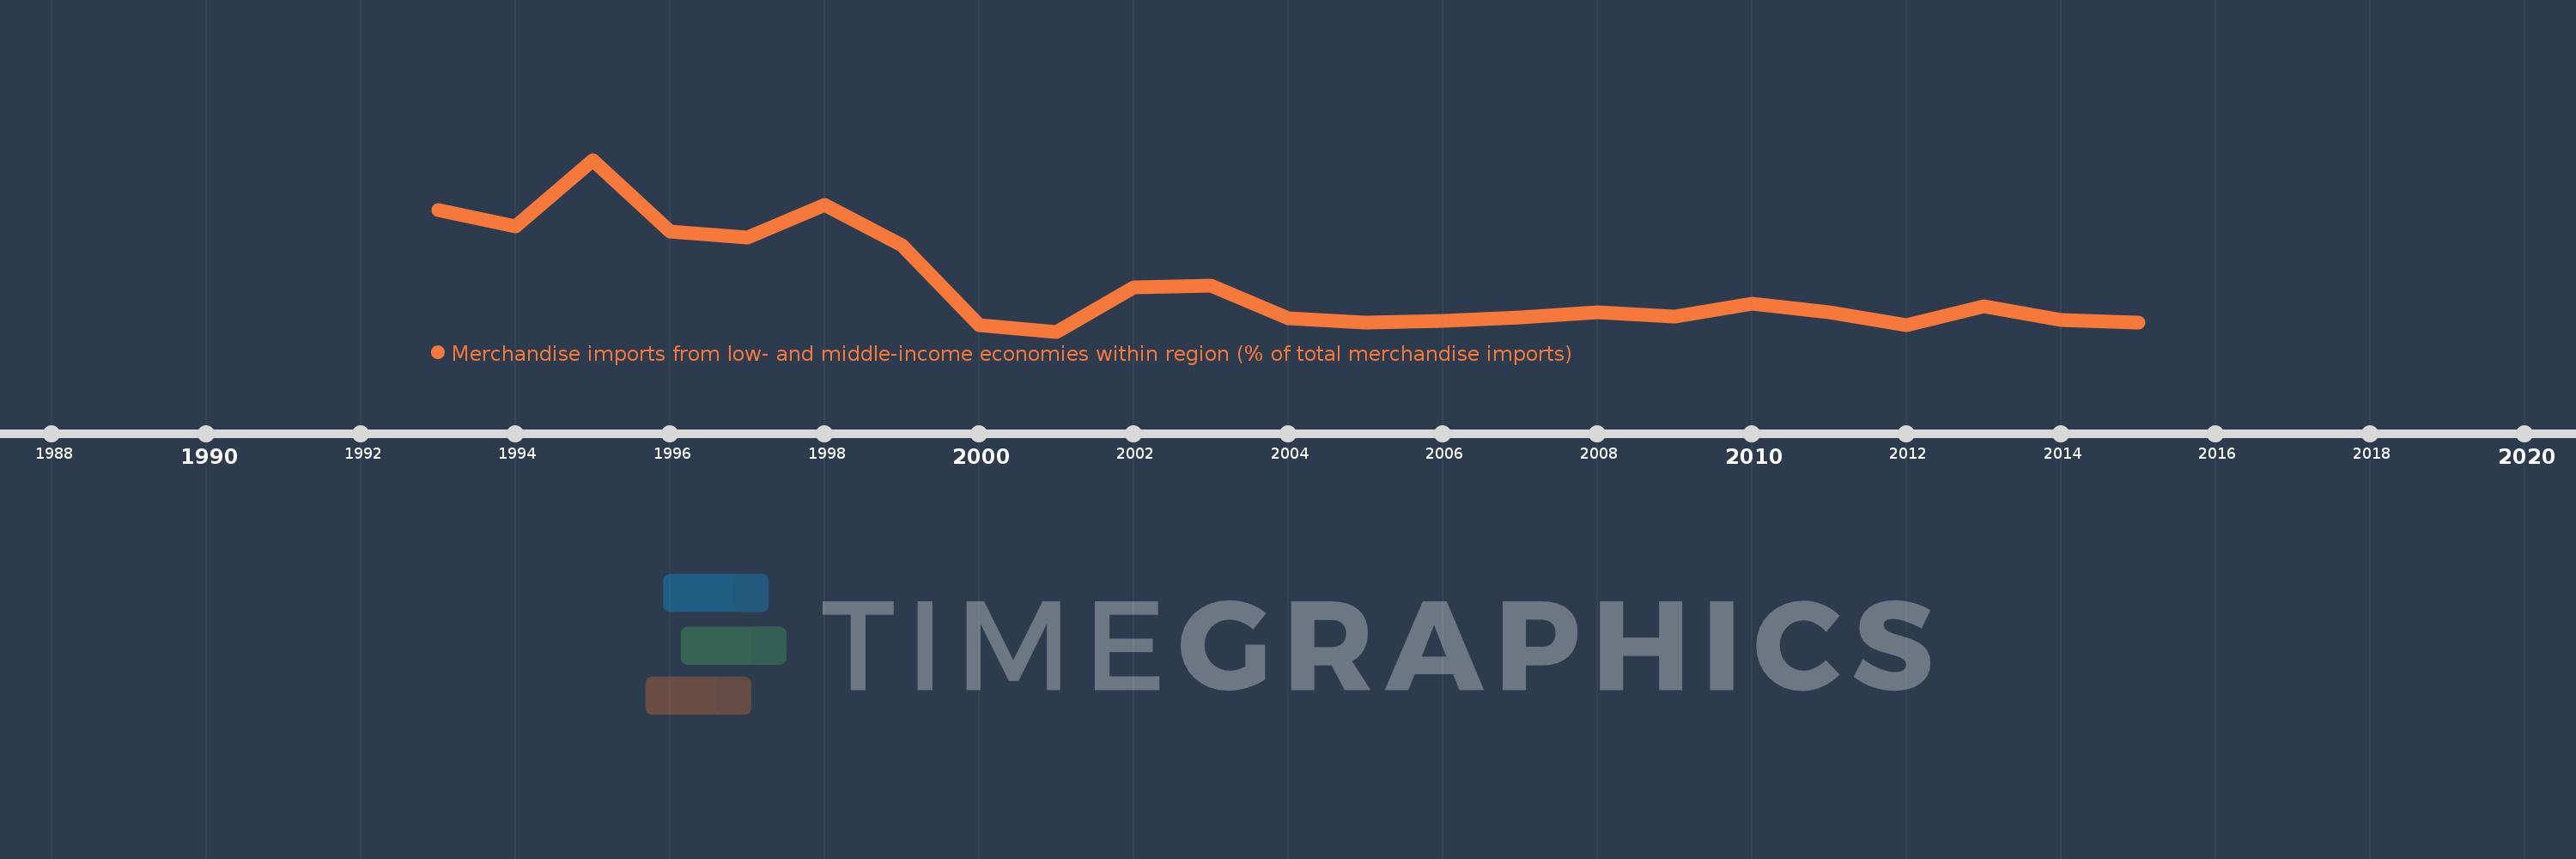
Merchandise imports from low- and middle-income economies within region (% of total merchandise imports)
2015,2014,2013,2012,2011,2010,2009,2008,2007,2006,2005,2004,2003,2002,2001,2000,1999,1998,1997,1996,1995,1994,1993
Estas estadísticas en otros países:
línea de tiempo (timeline):
En esta escala de tiempo se presenta un gráfico de 1993 y 2015 de Azerbaijan. Los datos de 1992 están ausentes. El número de observaciones reales por fecha: 23.
Fuente (nombre):
Indicadores del desarrollo mundial
Fuente (organización):
World Bank staff estimates based data from International Monetary Fund's Direction of Trade database.
Categorías:
Private Sector, Trade
Se ha actualizado:
23 abr 2017 año
Los indicadores de los cambios de valor en los últimos años
Mínimo:
22.958
1 ene 2001 año
Máximo:
57.313
1 ene 1995 año
A la fecha de observación
Valor
Cambio absoluto
El cambio con respecto al valor anterior
1 ene 1993 año
47.198
+47.198
0.0%
1 ene 1994 año
43.987
-3.211
-6.8%
1 ene 1995 año
57.313
+13.326
30.3%
1 ene 1996 año
42.967
-14.346
-25.03%
1 ene 1997 año
41.82
-1.147
-2.67%
1 ene 1998 año
48.304
+6.484
15.51%
1 ene 1999 año
40.27
-8.034
-16.63%
1 ene 2000 año
24.267
-16.003
-39.74%
1 ene 2001 año
22.958
-1.309
-5.39%
1 ene 2002 año
31.89
+8.932
38.9%
1 ene 2003 año
32.209
+0.319
1.0%
1 ene 2004 año
25.656
-6.553
-20.34%
1 ene 2005 año
24.743
-0.913
-3.56%
1 ene 2006 año
25.067
+0.324
1.31%
1 ene 2007 año
25.774
+0.707
2.82%
1 ene 2008 año
26.899
+1.124
4.36%
1 ene 2009 año
25.931
-0.968
-3.6%
1 ene 2010 año
28.458
+2.527
9.75%
1 ene 2011 año
26.771
-1.687
-5.93%
1 ene 2012 año
24.166
-2.604
-9.73%
1 ene 2013 año
27.978
+3.811
15.77%
1 ene 2014 año
25.205
-2.773
-9.91%
1 ene 2015 año
24.704
-0.501
-1.99%
Ranking de los países por los datos estadísticos actuales


Comentarios: