29
/es/
es
AIzaSyAYiBZKx7MnpbEhh9jyipgxe19OcubqV5w
April 1, 2024
43655
Latin America & the Caribbean (IDA & IBRD countries)
TLA
false
2
1
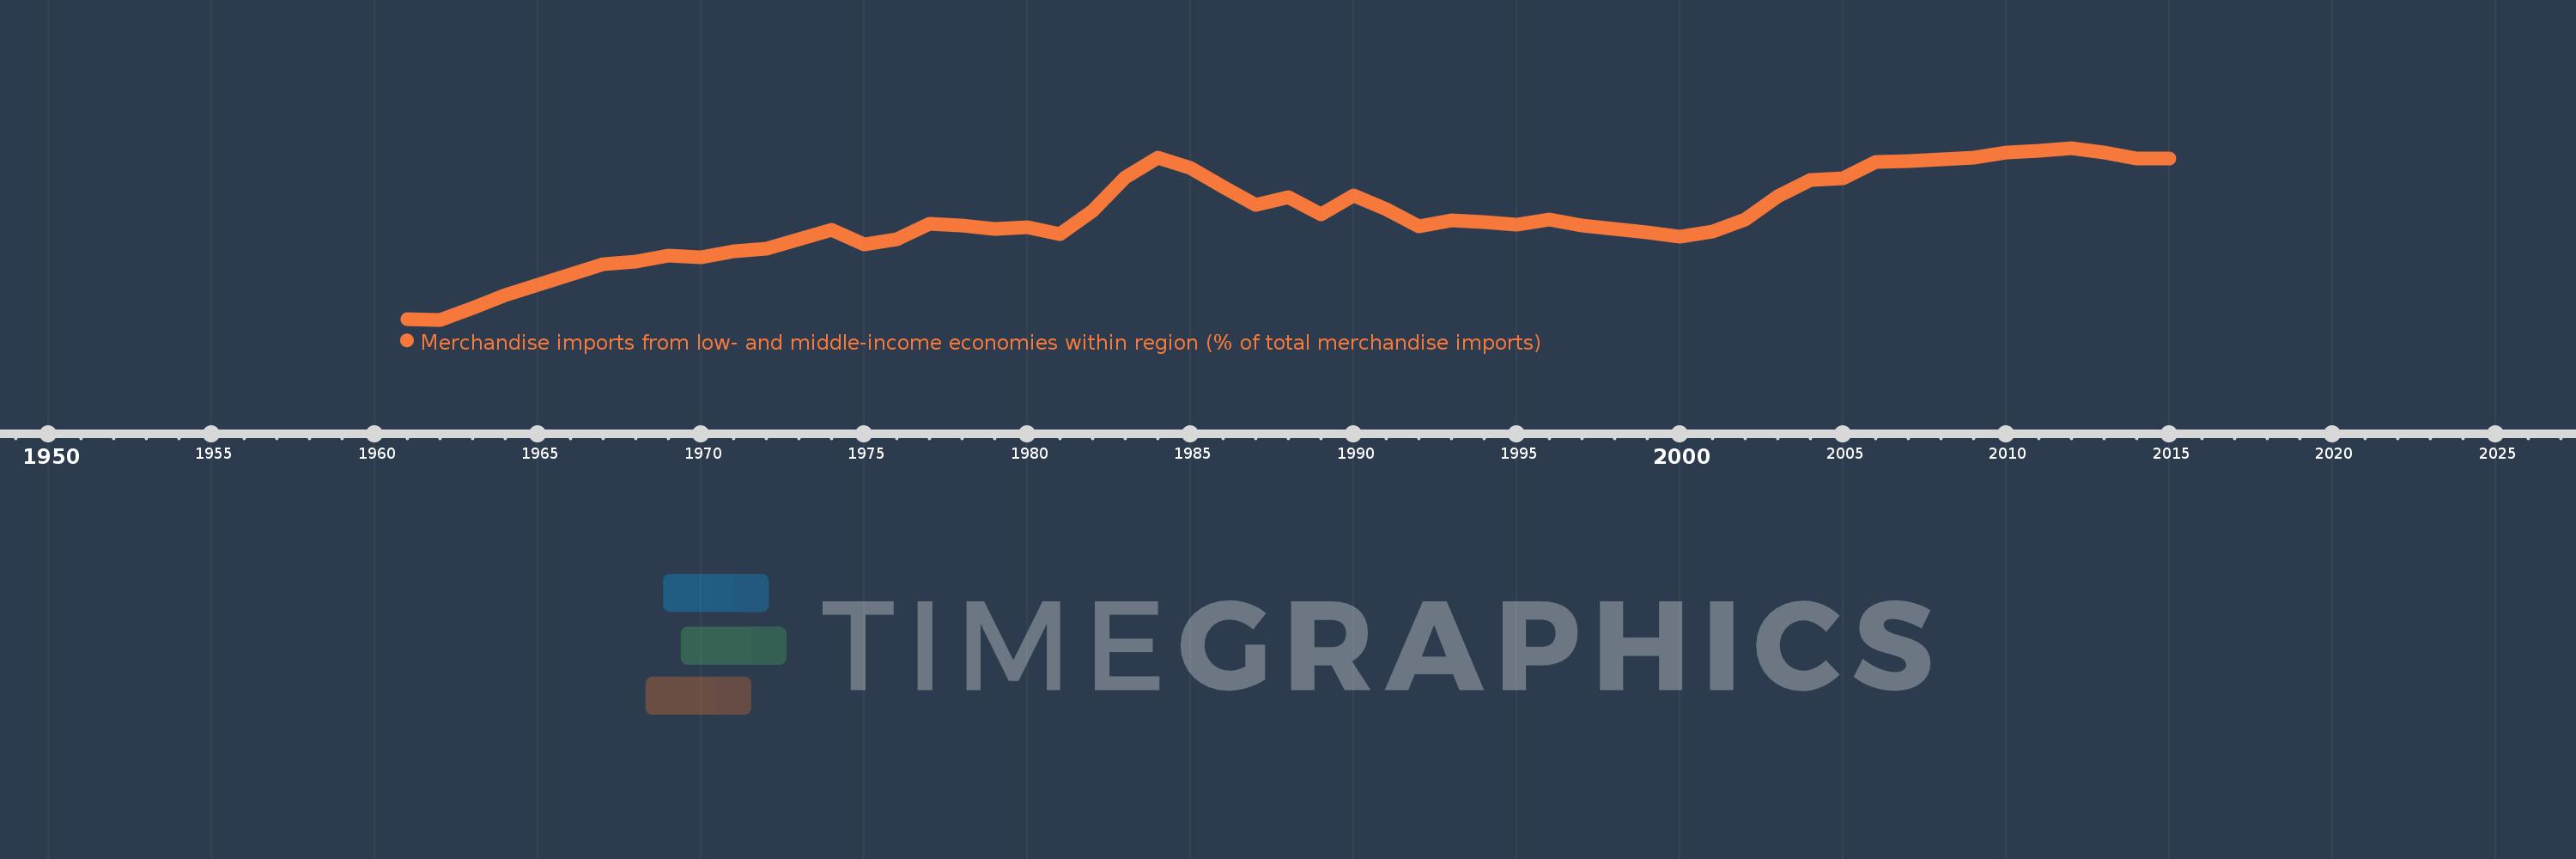
Merchandise imports from low- and middle-income economies within region (% of total merchandise imports)
2015,2014,2013,2012,2011,2010,2009,2008,2007,2006,2005,2004,2003,2002,2001,2000,1999,1998,1997,1996,1995,1994,1993,1992,1991,1990,1989,1988,1987,1986,1985,1984,1983,1982,1981,1980,1979,1978,1977,1976,1975,1974,1973,1972,1971,1970,1969,1968,1967,1966,1965,1964,1963,1962,1961
Estas estadísticas en otros países:
línea de tiempo (timeline):
En esta escala de tiempo se presenta un gráfico de 1961 y 2015 de Latin America & the Caribbean (IDA & IBRD countries). Los datos de 1960 están ausentes. El número de observaciones reales por fecha: 55.
Fuente (nombre):
Indicadores del desarrollo mundial
Fuente (organización):
World Bank staff estimates based data from International Monetary Fund's Direction of Trade database.
Categorías:
Private Sector, Trade
Se ha actualizado:
23 abr 2017 año
Los indicadores de los cambios de valor en los últimos años
Mínimo:
1.361
1 ene 1962 año
Máximo:
7.949
1 ene 2012 año
A la fecha de observación
Valor
Cambio absoluto
El cambio con respecto al valor anterior
1 ene 1961 año
1.4
+1.4
0.0%
1 ene 1962 año
1.361
-0.039
-2.82%
1 ene 1963 año
1.824
+0.463
34.03%
1 ene 1964 año
2.299
+0.475
26.06%
1 ene 1965 año
2.714
+0.415
18.04%
1 ene 1966 año
3.106
+0.392
14.43%
1 ene 1967 año
3.499
+0.394
12.67%
1 ene 1968 año
3.602
+0.103
2.93%
1 ene 1969 año
3.82
+0.218
6.06%
1 ene 1970 año
3.757
-0.063
-1.65%
1 ene 1971 año
3.999
+0.242
6.43%
1 ene 1972 año
4.076
+0.077
1.93%
1 ene 1973 año
4.45
+0.375
9.19%
1 ene 1974 año
4.799
+0.349
7.85%
1 ene 1975 año
4.243
-0.557
-11.61%
1 ene 1976 año
4.442
+0.199
4.7%
1 ene 1977 año
5.043
+0.601
13.54%
1 ene 1978 año
4.989
-0.055
-1.08%
1 ene 1979 año
4.849
-0.14
-2.8%
1 ene 1980 año
4.904
+0.055
1.13%
1 ene 1981 año
4.638
-0.266
-5.42%
1 ene 1982 año
5.529
+0.891
19.21%
1 ene 1983 año
6.826
+1.297
23.47%
1 ene 1984 año
7.585
+0.759
11.12%
1 ene 1985 año
7.193
-0.393
-5.18%
1 ene 1986 año
6.45
-0.743
-10.33%
1 ene 1987 año
5.755
-0.694
-10.77%
1 ene 1988 año
6.062
+0.306
5.32%
1 ene 1989 año
5.412
-0.65
-10.72%
1 ene 1990 año
6.117
+0.705
13.04%
1 ene 1991 año
5.614
-0.504
-8.23%
1 ene 1992 año
4.931
-0.683
-12.17%
1 ene 1993 año
5.177
+0.247
5.01%
1 ene 1994 año
5.114
-0.063
-1.22%
1 ene 1995 año
4.994
-0.12
-2.36%
1 ene 1996 año
5.199
+0.205
4.1%
1 ene 1997 año
4.976
-0.223
-4.29%
1 ene 1998 año
4.836
-0.14
-2.8%
1 ene 1999 año
4.712
-0.124
-2.56%
1 ene 2000 año
4.533
-0.18
-3.81%
1 ene 2001 año
4.74
+0.207
4.56%
1 ene 2002 año
5.194
+0.454
9.58%
1 ene 2003 año
6.086
+0.892
17.18%
1 ene 2004 año
6.713
+0.627
10.3%
1 ene 2005 año
6.784
+0.072
1.07%
1 ene 2006 año
7.413
+0.629
9.27%
1 ene 2007 año
7.447
+0.034
0.46%
1 ene 2008 año
7.506
+0.059
0.79%
1 ene 2009 año
7.58
+0.074
0.99%
1 ene 2010 año
7.776
+0.196
2.59%
1 ene 2011 año
7.838
+0.061
0.79%
1 ene 2012 año
7.949
+0.111
1.42%
1 ene 2013 año
7.785
-0.164
-2.06%
1 ene 2014 año
7.552
-0.233
-2.99%
1 ene 2015 año
7.55
-0.002
-0.02%
Ranking de los países por los datos estadísticos actuales


Comentarios: