29
/es/
es
AIzaSyAYiBZKx7MnpbEhh9jyipgxe19OcubqV5w
April 1, 2024
211991
Niger
NER
true
2
1
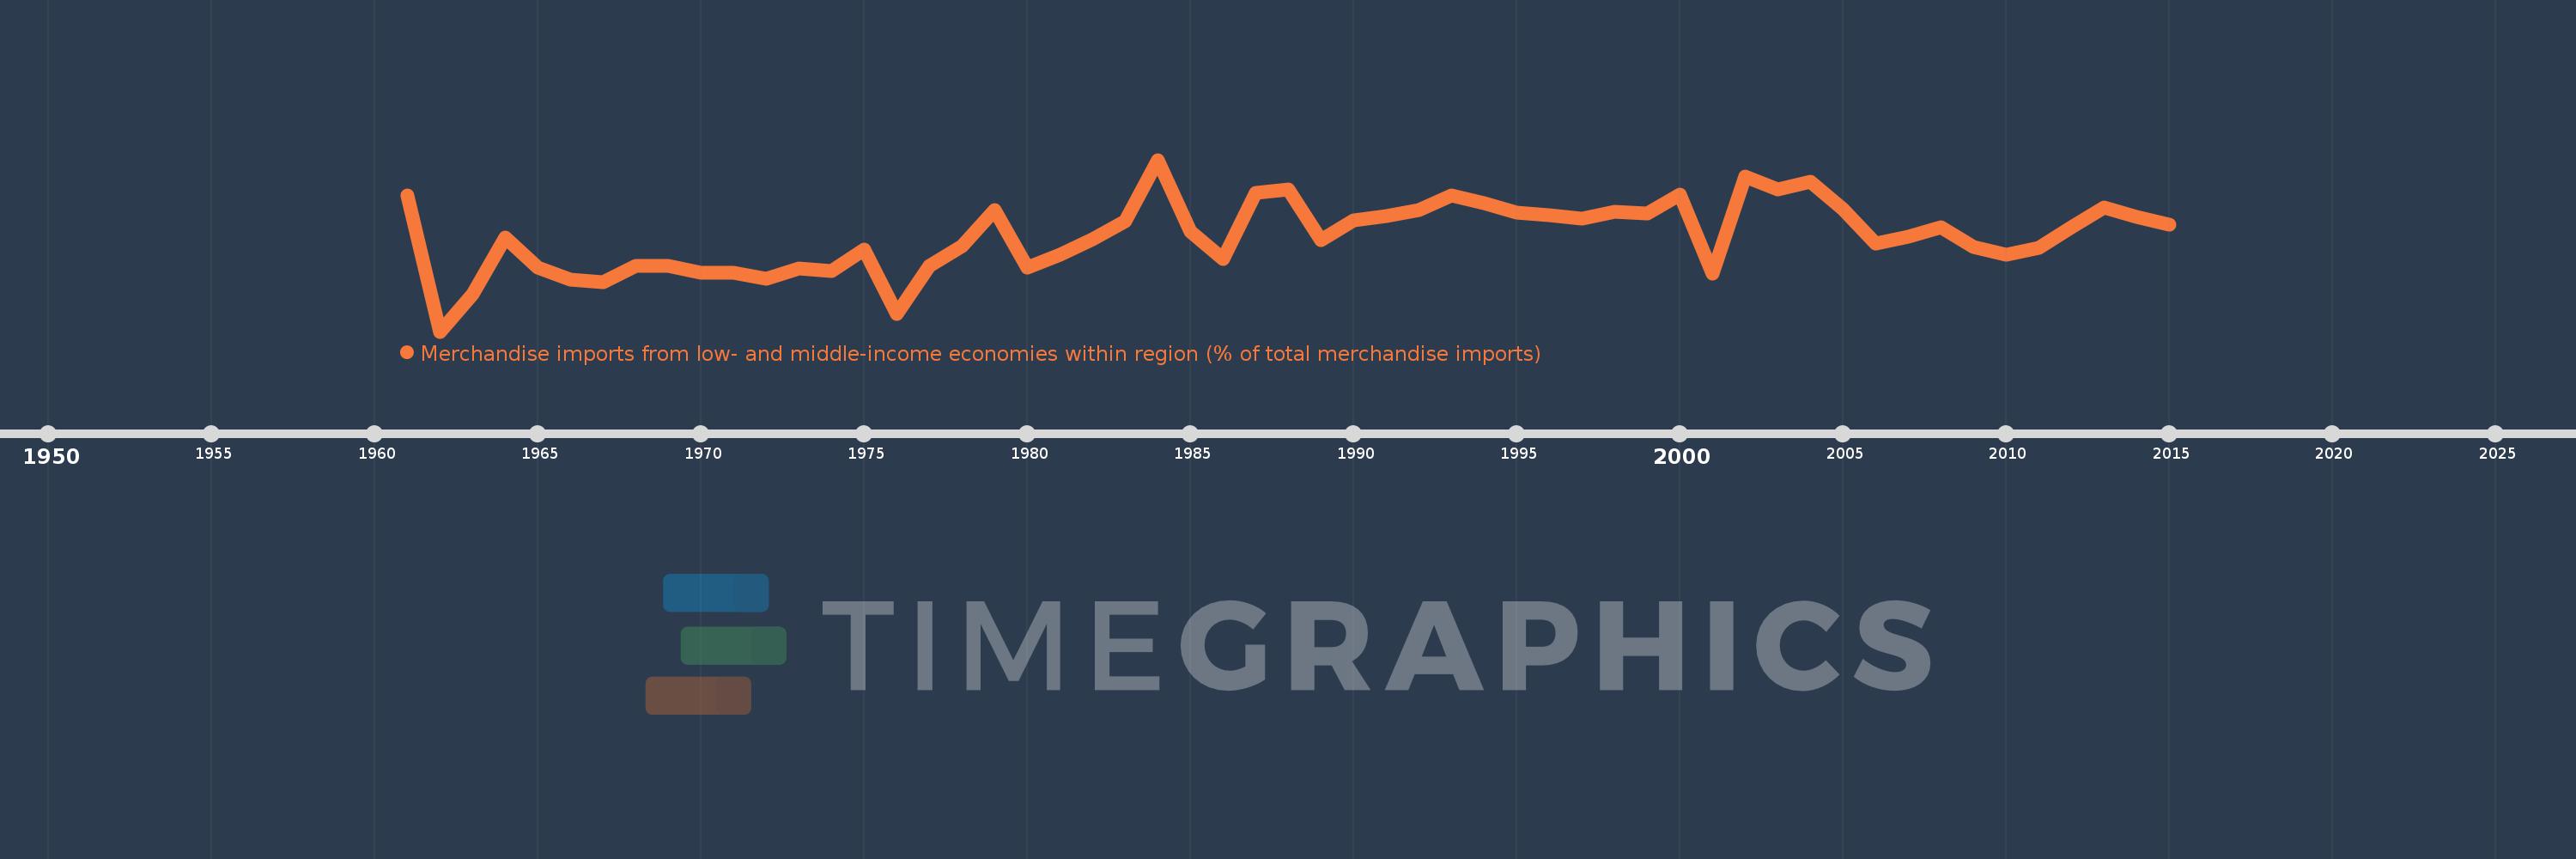
Merchandise imports from low- and middle-income economies within region (% of total merchandise imports)
2015,2014,2013,2012,2011,2010,2009,2008,2007,2006,2005,2004,2003,2002,2001,2000,1999,1998,1997,1996,1995,1994,1993,1992,1991,1990,1989,1988,1987,1986,1985,1984,1983,1982,1981,1980,1979,1978,1977,1976,1975,1974,1973,1972,1971,1970,1969,1968,1967,1966,1965,1964,1963,1962,1961
Estas estadísticas en otros países:
línea de tiempo (timeline):
En esta escala de tiempo se presenta un gráfico de 1961 y 2015 de Niger. Los datos de 1960 están ausentes. El número de observaciones reales por fecha: 55.
Fuente (nombre):
Indicadores del desarrollo mundial
Fuente (organización):
World Bank staff estimates based data from International Monetary Fund's Direction of Trade database.
Categorías:
Private Sector, Trade
Se ha actualizado:
23 abr 2017 año
Los indicadores de los cambios de valor en los últimos años
Máximo:
38.906
1 ene 1984 año
A la fecha de observación
Valor
Cambio absoluto
El cambio con respecto al valor anterior
1 ene 1961 año
30.882
+30.882
0.0%
1 ene 1962 año
0.0
-30.882
-100.0%
1 ene 1963 año
8.425
+8.425
%
1 ene 1964 año
21.333
+12.908
153.22%
1 ene 1965 año
14.462
-6.872
-32.21%
1 ene 1966 año
11.828
-2.634
-18.21%
1 ene 1967 año
11.111
-0.717
-6.06%
1 ene 1968 año
14.945
+3.834
34.51%
1 ene 1969 año
14.8
-0.145
-0.97%
1 ene 1970 año
13.357
-1.443
-9.75%
1 ene 1971 año
13.285
-0.072
-0.54%
1 ene 1972 año
11.868
-1.417
-10.67%
1 ene 1973 año
14.221
+2.352
19.82%
1 ene 1974 año
13.807
-0.413
-2.91%
1 ene 1975 año
18.653
+4.845
35.09%
1 ene 1976 año
3.95
-14.702
-78.82%
1 ene 1977 año
14.954
+11.003
278.54%
1 ene 1978 año
19.448
+4.494
30.05%
1 ene 1979 año
27.429
+7.981
41.04%
1 ene 1980 año
14.48
-12.949
-47.21%
1 ene 1981 año
17.344
+2.864
19.78%
1 ene 1982 año
20.931
+3.587
20.68%
1 ene 1983 año
25.043
+4.112
19.64%
1 ene 1984 año
38.906
+13.863
55.36%
1 ene 1985 año
22.737
-16.169
-41.56%
1 ene 1986 año
16.472
-6.265
-27.55%
1 ene 1987 año
31.322
+14.85
90.15%
1 ene 1988 año
32.194
+0.872
2.78%
1 ene 1989 año
20.755
-11.439
-35.53%
1 ene 1990 año
25.142
+4.387
21.14%
1 ene 1991 año
26.107
+0.964
3.84%
1 ene 1992 año
27.473
+1.367
5.24%
1 ene 1993 año
30.889
+3.416
12.43%
1 ene 1994 año
29.034
-1.855
-6.01%
1 ene 1995 año
27.022
-2.012
-6.93%
1 ene 1996 año
26.285
-0.737
-2.73%
1 ene 1997 año
25.672
-0.613
-2.33%
1 ene 1998 año
27.05
+1.377
5.37%
1 ene 1999 año
26.817
-0.232
-0.86%
1 ene 2000 año
30.954
+4.137
15.43%
1 ene 2001 año
13.168
-17.786
-57.46%
1 ene 2002 año
35.04
+21.873
166.11%
1 ene 2003 año
32.247
-2.794
-7.97%
1 ene 2004 año
33.964
+1.717
5.33%
1 ene 2005 año
27.699
-6.265
-18.45%
1 ene 2006 año
19.846
-7.853
-28.35%
1 ene 2007 año
21.573
+1.727
8.7%
1 ene 2008 año
23.553
+1.98
9.18%
1 ene 2009 año
19.094
-4.459
-18.93%
1 ene 2010 año
17.476
-1.618
-8.47%
1 ene 2011 año
18.897
+1.421
8.13%
1 ene 2012 año
23.6
+4.703
24.88%
1 ene 2013 año
28.047
+4.447
18.85%
1 ene 2014 año
25.949
-2.098
-7.48%
1 ene 2015 año
24.219
-1.73
-6.67%
Ranking de los países por los datos estadísticos actuales


Comentarios: