29
/es/
es
AIzaSyAYiBZKx7MnpbEhh9jyipgxe19OcubqV5w
April 1, 2024
39208
IDA only
IDX
false
2
1
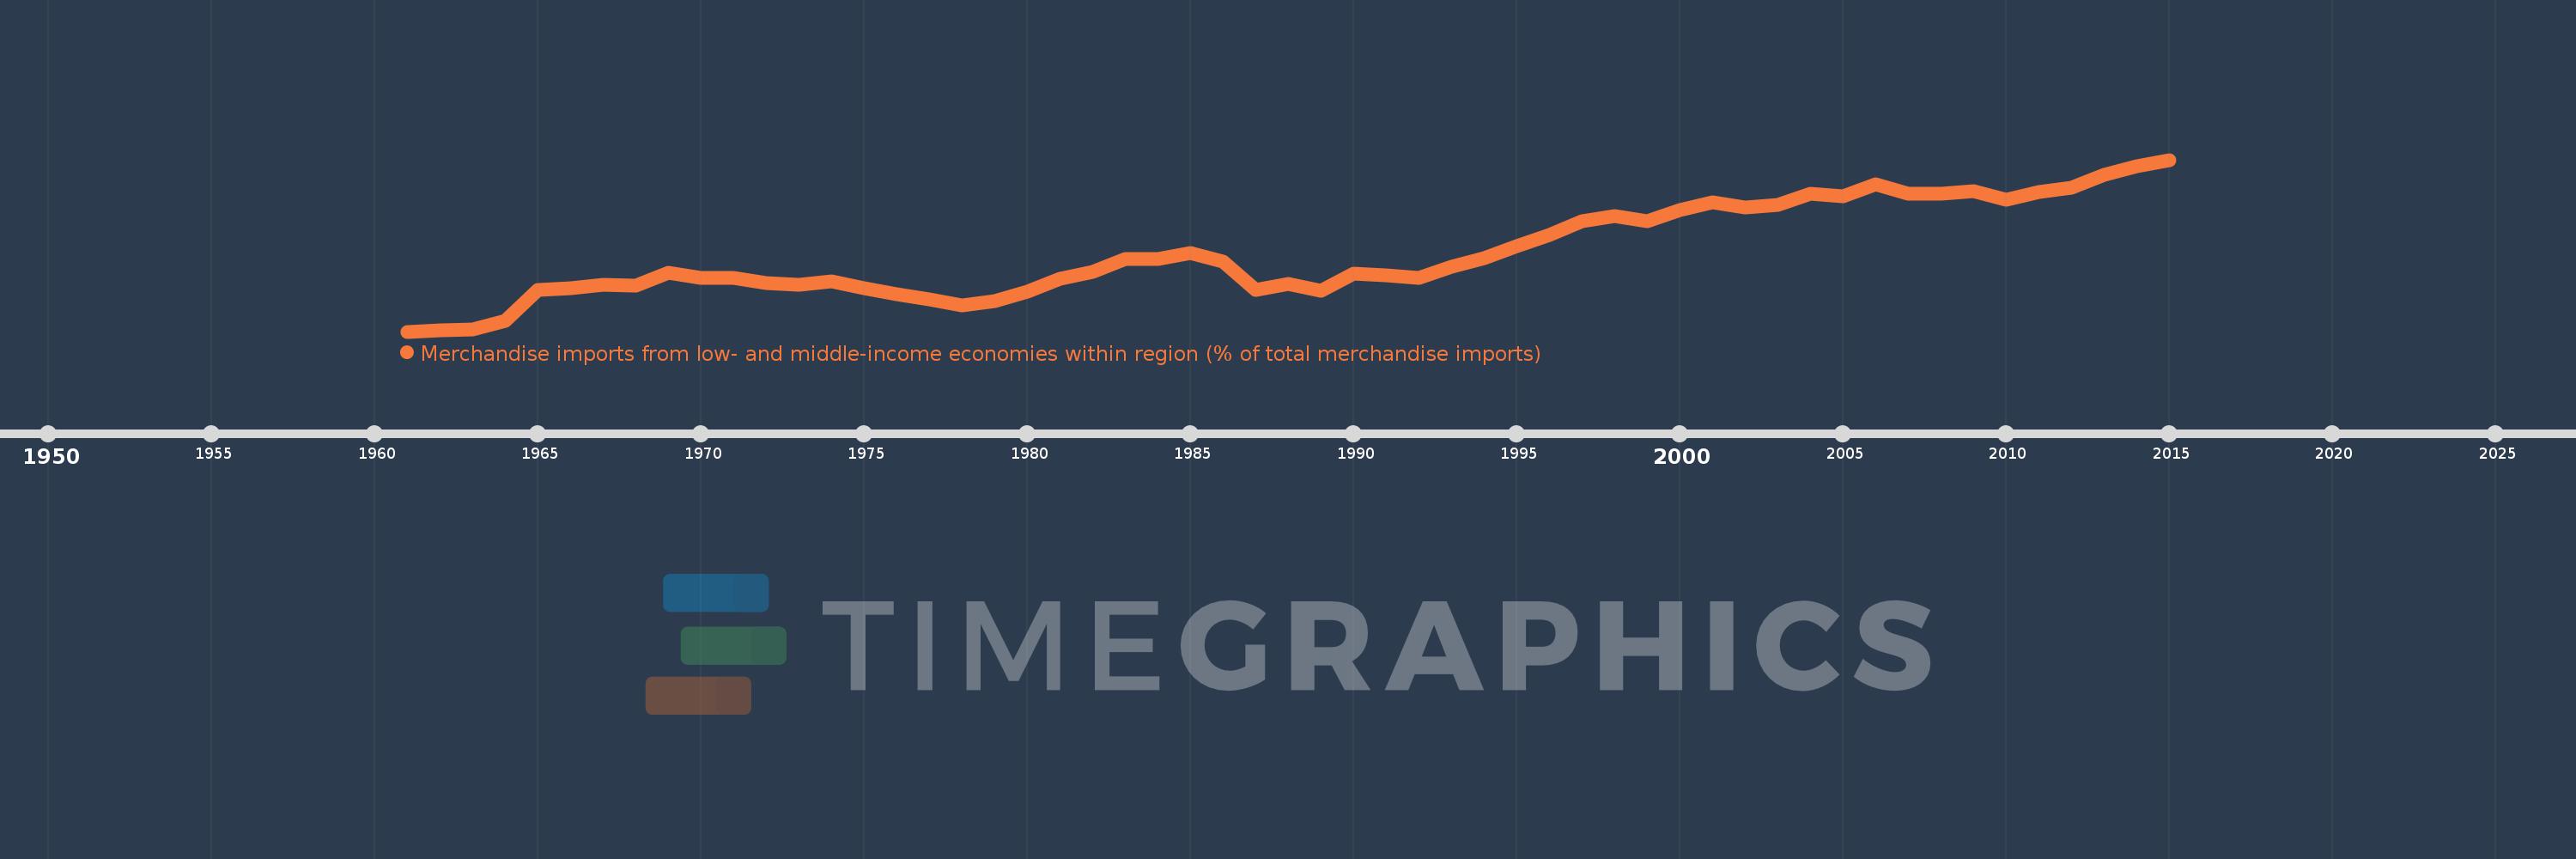
Merchandise imports from low- and middle-income economies within region (% of total merchandise imports)
2015,2014,2013,2012,2011,2010,2009,2008,2007,2006,2005,2004,2003,2002,2001,2000,1999,1998,1997,1996,1995,1994,1993,1992,1991,1990,1989,1988,1987,1986,1985,1984,1983,1982,1981,1980,1979,1978,1977,1976,1975,1974,1973,1972,1971,1970,1969,1968,1967,1966,1965,1964,1963,1962,1961
Estas estadísticas en otros países:
línea de tiempo (timeline):
En esta escala de tiempo se presenta un gráfico de 1961 y 2015 de IDA only. Los datos de 1960 están ausentes. El número de observaciones reales por fecha: 55.
Fuente (nombre):
Indicadores del desarrollo mundial
Fuente (organización):
World Bank staff estimates based data from International Monetary Fund's Direction of Trade database.
Categorías:
Private Sector, Trade
Se ha actualizado:
23 abr 2017 año
Los indicadores de los cambios de valor en los últimos años
Mínimo:
4.791
1 ene 1961 año
Máximo:
25.796
1 ene 2015 año
A la fecha de observación
Valor
Cambio absoluto
El cambio con respecto al valor anterior
1 ene 1961 año
4.791
+4.791
0.0%
1 ene 1962 año
4.995
+0.204
4.27%
1 ene 1963 año
5.086
+0.091
1.82%
1 ene 1964 año
6.114
+1.028
20.22%
1 ene 1965 año
9.875
+3.76
61.5%
1 ene 1966 año
10.141
+0.267
2.7%
1 ene 1967 año
10.469
+0.328
3.23%
1 ene 1968 año
10.442
-0.027
-0.26%
1 ene 1969 año
12.014
+1.571
15.05%
1 ene 1970 año
11.349
-0.664
-5.53%
1 ene 1971 año
11.377
+0.028
0.25%
1 ene 1972 año
10.739
-0.638
-5.61%
1 ene 1973 año
10.53
-0.21
-1.95%
1 ene 1974 año
10.912
+0.383
3.63%
1 ene 1975 año
10.129
-0.783
-7.18%
1 ene 1976 año
9.313
-0.816
-8.06%
1 ene 1977 año
8.702
-0.611
-6.56%
1 ene 1978 año
8.042
-0.66
-7.58%
1 ene 1979 año
8.551
+0.509
6.33%
1 ene 1980 año
9.675
+1.124
13.14%
1 ene 1981 año
11.288
+1.614
16.68%
1 ene 1982 año
12.061
+0.773
6.84%
1 ene 1983 año
13.648
+1.587
13.16%
1 ene 1984 año
13.646
-0.002
-0.01%
1 ene 1985 año
14.424
+0.778
5.7%
1 ene 1986 año
13.32
-1.104
-7.65%
1 ene 1987 año
9.856
-3.464
-26.01%
1 ene 1988 año
10.609
+0.753
7.64%
1 ene 1989 año
9.784
-0.825
-7.78%
1 ene 1990 año
11.902
+2.118
21.65%
1 ene 1991 año
11.703
-0.199
-1.67%
1 ene 1992 año
11.378
-0.324
-2.77%
1 ene 1993 año
12.748
+1.37
12.04%
1 ene 1994 año
13.796
+1.048
8.22%
1 ene 1995 año
15.228
+1.432
10.38%
1 ene 1996 año
16.564
+1.335
8.77%
1 ene 1997 año
18.242
+1.678
10.13%
1 ene 1998 año
18.931
+0.69
3.78%
1 ene 1999 año
18.294
-0.637
-3.37%
1 ene 2000 año
19.61
+1.316
7.19%
1 ene 2001 año
20.599
+0.989
5.05%
1 ene 2002 año
19.999
-0.6
-2.91%
1 ene 2003 año
20.255
+0.256
1.28%
1 ene 2004 año
21.653
+1.398
6.9%
1 ene 2005 año
21.289
-0.364
-1.68%
1 ene 2006 año
22.843
+1.554
7.3%
1 ene 2007 año
21.664
-1.18
-5.16%
1 ene 2008 año
21.655
-0.009
-0.04%
1 ene 2009 año
21.949
+0.294
1.36%
1 ene 2010 año
20.949
-0.999
-4.55%
1 ene 2011 año
21.845
+0.895
4.27%
1 ene 2012 año
22.413
+0.568
2.6%
1 ene 2013 año
23.99
+1.578
7.04%
1 ene 2014 año
25.013
+1.023
4.26%
1 ene 2015 año
25.796
+0.783
3.13%
Ranking de los países por los datos estadísticos actuales


Comentarios: