29
/es/
es
AIzaSyAYiBZKx7MnpbEhh9jyipgxe19OcubqV5w
April 1, 2024
74246
Austria
AUT
true
2
1
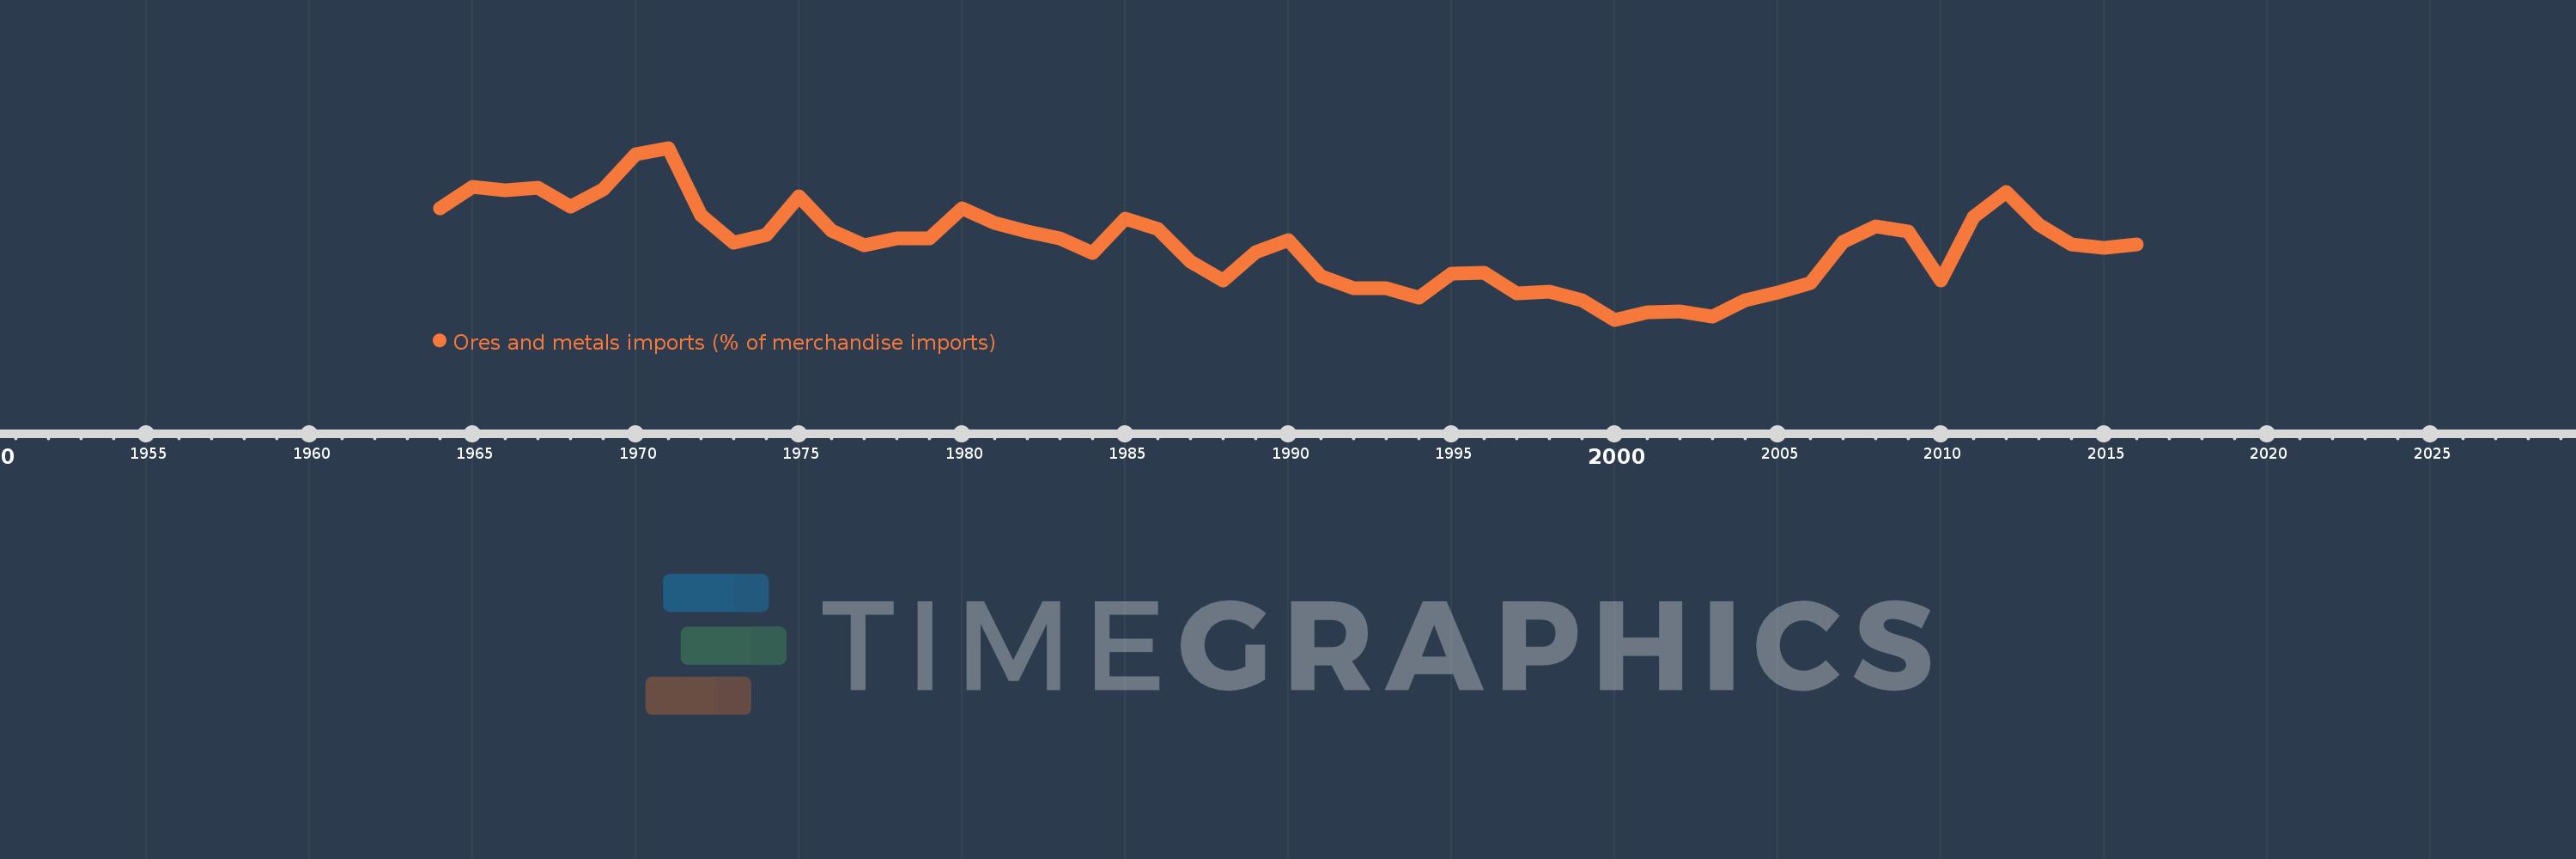
Ores and metals imports (% of merchandise imports)
2016,2015,2014,2013,2012,2011,2010,2009,2008,2007,2006,2005,2004,2003,2002,2001,2000,1999,1998,1997,1996,1995,1994,1993,1992,1991,1990,1989,1988,1987,1986,1985,1984,1983,1982,1981,1980,1979,1978,1977,1976,1975,1974,1973,1972,1971,1970,1969,1968,1967,1966,1965,1964
Estas estadísticas en otros países:
AfghanistanAlbaniaAlgeriaAndorraAngolaAntigua and BarbudaArab WorldArgentinaArmeniaArubaAustraliaAustriaAzerbaijanBahamas, TheBahrainBangladeshBarbadosBelarusBelgiumBelizeBeninBermudaBhutanBoliviaBosnia and HerzegovinaBotswanaBrazilBrunei DarussalamBulgariaBurkina FasoBurundiCabo VerdeCambodiaCameroonCanadaCaribbean small statesCayman IslandsCentral African RepublicCentral Europe and the BalticsChadChileChinaColombiaComorosCongo, Dem. Rep.Congo, Rep.Costa RicaCote d'IvoireCroatiaCubaCyprusCzech RepublicDenmarkDjiboutiDominicaDominican RepublicEarly-demographic dividendEast Asia & PacificEast Asia & Pacific (excluding high income)East Asia & Pacific (IDA & IBRD countries)EcuadorEgypt, Arab Rep.El SalvadorEquatorial GuineaEritreaEstoniaEthiopiaEuro areaEurope & Central AsiaEurope & Central Asia (excluding high income)Europe & Central Asia (IDA & IBRD countries)European UnionFaroe IslandsFijiFinlandFragile and conflict affected situationsFranceFrench PolynesiaGabonGambia, TheGeorgiaGermanyGhanaGreeceGreenlandGrenadaGuatemalaGuineaGuinea-BissauGuyanaHaitiHeavily indebted poor countries (HIPC)High incomeHondurasHong Kong SAR, ChinaHungaryIBRD onlyIcelandIDA & IBRD totalIDA blendIDA onlyIDA totalIndiaIndonesiaIran, Islamic Rep.IraqIrelandIsraelItalyJamaicaJapanJordanKazakhstanKenyaKiribatiKorea, Rep.KuwaitKyrgyz RepublicLao PDRLate-demographic dividendLatin America & Caribbean Latin America & Caribbean (excluding high income)Latin America & the Caribbean (IDA & IBRD countries)LatviaLeast developed countries: UN classificationLebanonLesothoLiberiaLibyaLithuaniaLow & middle incomeLow incomeLower middle incomeLuxembourgMacao SAR, ChinaMacedonia, FYRMadagascarMalawiMalaysiaMaldivesMaliMaltaMauritaniaMauritiusMexicoMiddle East & North AfricaMiddle East & North Africa (excluding high income)Middle East & North Africa (IDA & IBRD countries)Middle incomeMoldovaMongoliaMoroccoMozambiqueMyanmarNamibiaNepalNetherlandsNew CaledoniaNew ZealandNicaraguaNigerNigeriaNorth AmericaNorwayOECD membersOmanOther small statesPacific island small statesPakistanPalauPanamaPapua New GuineaParaguayPeruPhilippinesPolandPortugalPost-demographic dividendPre-demographic dividendQatarRomaniaRussian FederationRwandaSamoaSao Tome and PrincipeSaudi ArabiaSenegalSerbiaSeychellesSierra LeoneSingaporeSlovak RepublicSloveniaSmall statesSolomon IslandsSomaliaSouth AfricaSouth AsiaSouth Asia (IDA & IBRD)SpainSri LankaSt. Kitts and NevisSt. LuciaSt. Vincent and the GrenadinesSub-Saharan Africa Sub-Saharan Africa (excluding high income)Sub-Saharan Africa (IDA & IBRD countries)SudanSurinameSwazilandSwedenSwitzerlandSyrian Arab RepublicTajikistanTanzaniaThailandTimor-LesteTogoTongaTrinidad and TobagoTunisiaTurkeyTurkmenistanTurks and Caicos IslandsTuvaluUgandaUkraineUnited Arab EmiratesUnited KingdomUnited StatesUpper middle incomeUruguayVanuatuVenezuela, RBVietnamVirgin Islands (U.S.)WorldYemen, Rep.ZambiaZimbabwe línea de tiempo (timeline):
En esta escala de tiempo se presenta un gráfico de 1964 y 2016 de Austria. Los datos de 1963 están ausentes. El número de observaciones reales por fecha: 53.
Fuente (nombre):
Indicadores del desarrollo mundial
Fuente (organización):
World Bank staff estimates from the Comtrade database maintained by the United Nations Statistics Division.
Categorías:
Energy & Mining, Private Sector, Trade
Se ha actualizado:
23 abr 2017 año
Los indicadores de los cambios de valor en los últimos años
Mínimo:
2.669
1 ene 2000 año
Máximo:
7.191
1 ene 1971 año
A la fecha de observación
Valor
Cambio absoluto
El cambio con respecto al valor anterior
1 ene 1964 año
5.606
+5.606
0.0%
1 ene 1965 año
6.174
+0.568
10.13%
1 ene 1966 año
6.072
-0.102
-1.65%
1 ene 1967 año
6.137
+0.065
1.08%
1 ene 1968 año
5.652
-0.485
-7.9%
1 ene 1969 año
6.092
+0.439
7.77%
1 ene 1970 año
7.016
+0.924
15.17%
1 ene 1971 año
7.191
+0.175
2.5%
1 ene 1972 año
5.415
-1.777
-24.71%
1 ene 1973 año
4.705
-0.71
-13.12%
1 ene 1974 año
4.903
+0.198
4.21%
1 ene 1975 año
5.915
+1.012
20.64%
1 ene 1976 año
5.008
-0.907
-15.34%
1 ene 1977 año
4.624
-0.384
-7.66%
1 ene 1978 año
4.813
+0.189
4.08%
1 ene 1979 año
4.814
+0.001
0.03%
1 ene 1980 año
5.591
+0.777
16.14%
1 ene 1981 año
5.208
-0.383
-6.86%
1 ene 1982 año
4.988
-0.219
-4.21%
1 ene 1983 año
4.819
-0.169
-3.39%
1 ene 1984 año
4.435
-0.384
-7.98%
1 ene 1985 año
5.325
+0.89
20.07%
1 ene 1986 año
5.048
-0.277
-5.21%
1 ene 1987 año
4.199
-0.849
-16.82%
1 ene 1988 año
3.711
-0.488
-11.63%
1 ene 1989 año
4.457
+0.746
20.11%
1 ene 1990 año
4.754
+0.298
6.68%
1 ene 1991 año
3.821
-0.933
-19.62%
1 ene 1992 año
3.488
-0.334
-8.73%
1 ene 1993 año
3.504
+0.017
0.48%
1 ene 1994 año
3.257
-0.247
-7.05%
1 ene 1995 año
3.883
+0.625
19.19%
1 ene 1996 año
3.914
+0.031
0.8%
1 ene 1997 año
3.373
-0.54
-13.81%
1 ene 1998 año
3.411
+0.038
1.11%
1 ene 1999 año
3.184
-0.227
-6.65%
1 ene 2000 año
2.669
-0.515
-16.16%
1 ene 2001 año
2.875
+0.205
7.7%
1 ene 2002 año
2.897
+0.022
0.77%
1 ene 2003 año
2.742
-0.154
-5.33%
1 ene 2004 año
3.179
+0.436
15.91%
1 ene 2005 año
3.378
+0.199
6.25%
1 ene 2006 año
3.631
+0.254
7.51%
1 ene 2007 año
4.731
+1.1
30.28%
1 ene 2008 año
5.133
+0.403
8.51%
1 ene 2009 año
4.989
-0.144
-2.81%
1 ene 2010 año
3.703
-1.286
-25.78%
1 ene 2011 año
5.385
+1.682
45.43%
1 ene 2012 año
6.032
+0.647
12.01%
1 ene 2013 año
5.169
-0.863
-14.31%
1 ene 2014 año
4.663
-0.506
-9.79%
1 ene 2015 año
4.558
-0.105
-2.26%
1 ene 2016 año
4.661
+0.103
2.27%
Ranking de los países por los datos estadísticos actuales


Comentarios: