29
/es/
es
AIzaSyAYiBZKx7MnpbEhh9jyipgxe19OcubqV5w
April 1, 2024
249178
Sri Lanka
LKA
true
2
1
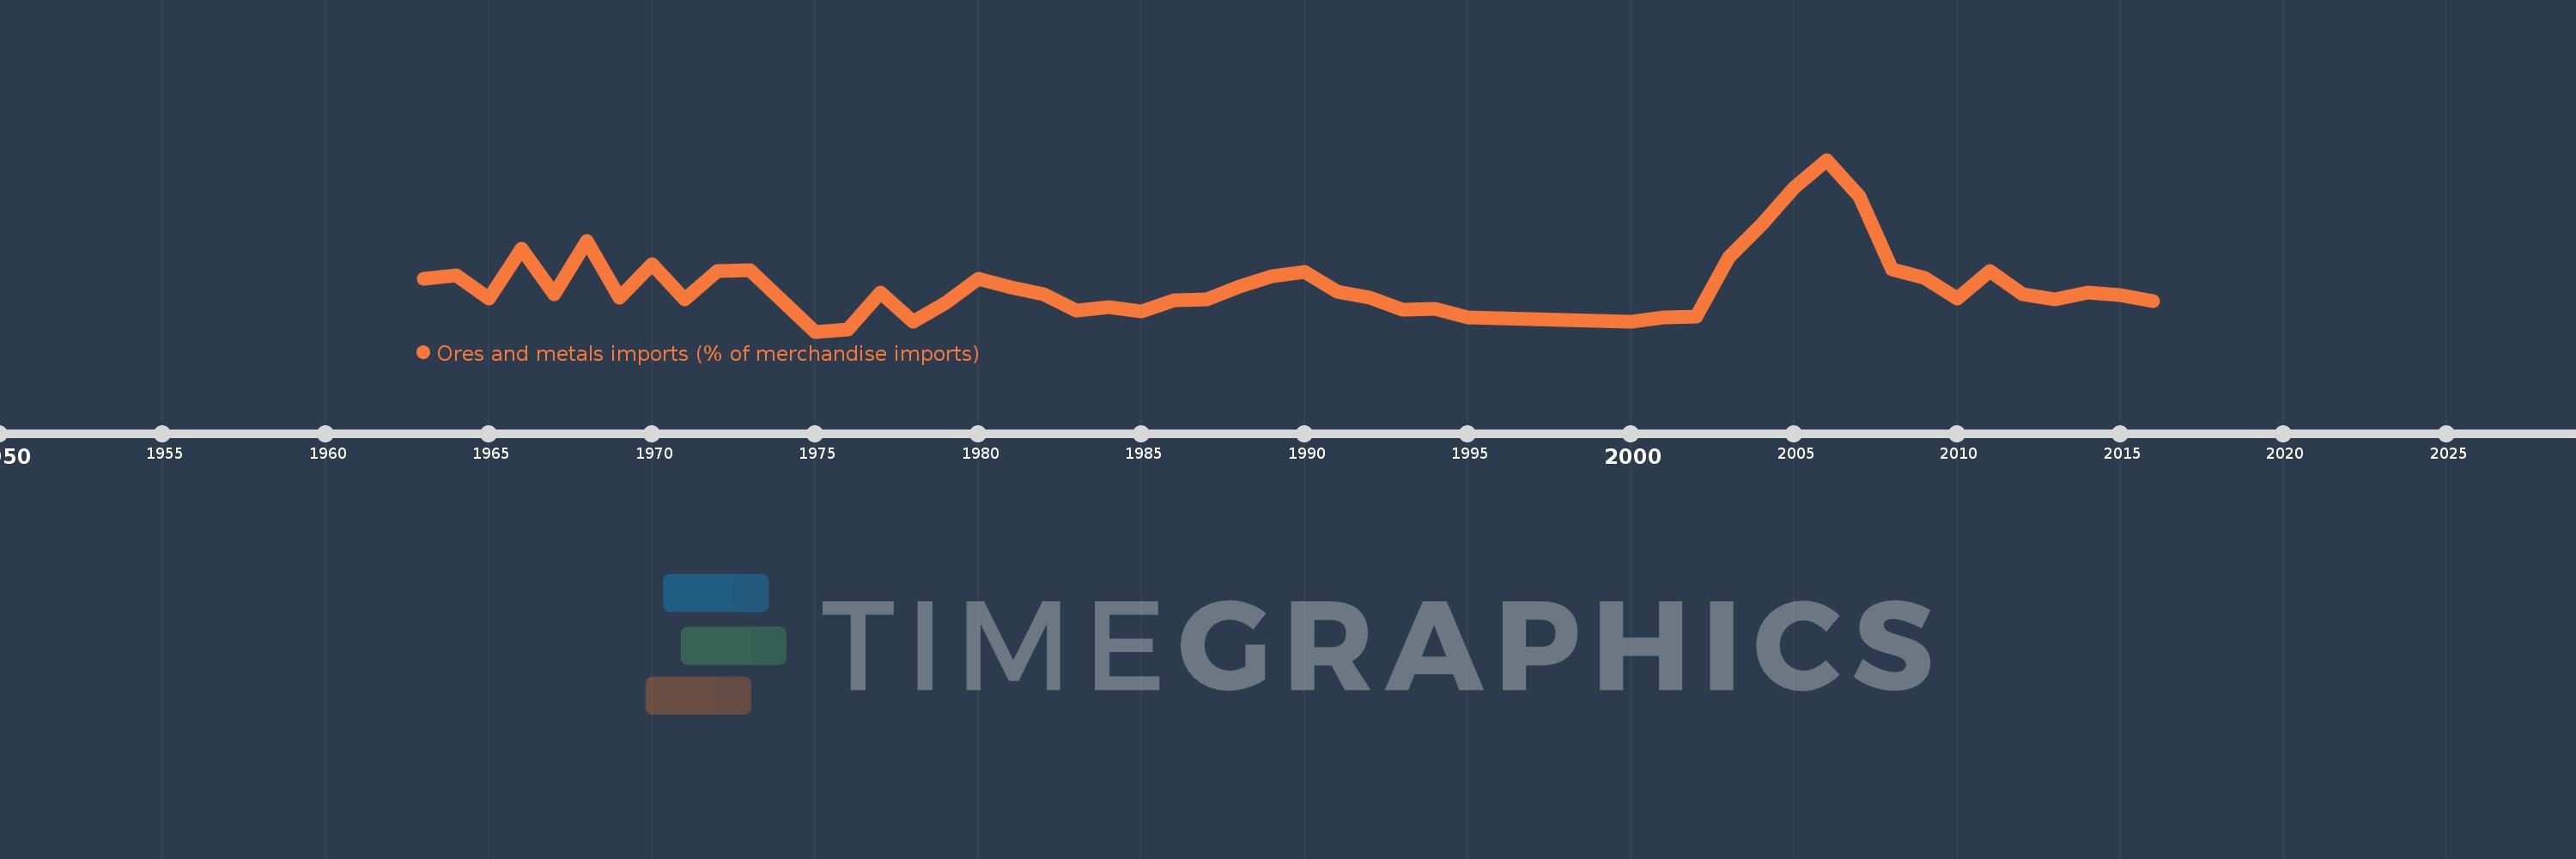
Ores and metals imports (% of merchandise imports)
2016,2015,2014,2013,2012,2011,2010,2009,2008,2007,2006,2005,2004,2003,2002,2001,2000,1995,1994,1993,1992,1991,1990,1989,1988,1987,1986,1985,1984,1983,1982,1981,1980,1979,1978,1977,1976,1975,1973,1972,1971,1970,1969,1968,1967,1966,1965,1964,1963
Estas estadísticas en otros países:
AfghanistanAlbaniaAlgeriaAndorraAngolaAntigua and BarbudaArab WorldArgentinaArmeniaArubaAustraliaAustriaAzerbaijanBahamas, TheBahrainBangladeshBarbadosBelarusBelgiumBelizeBeninBermudaBhutanBoliviaBosnia and HerzegovinaBotswanaBrazilBrunei DarussalamBulgariaBurkina FasoBurundiCabo VerdeCambodiaCameroonCanadaCaribbean small statesCayman IslandsCentral African RepublicCentral Europe and the BalticsChadChileChinaColombiaComorosCongo, Dem. Rep.Congo, Rep.Costa RicaCote d'IvoireCroatiaCubaCyprusCzech RepublicDenmarkDjiboutiDominicaDominican RepublicEarly-demographic dividendEast Asia & PacificEast Asia & Pacific (excluding high income)East Asia & Pacific (IDA & IBRD countries)EcuadorEgypt, Arab Rep.El SalvadorEquatorial GuineaEritreaEstoniaEthiopiaEuro areaEurope & Central AsiaEurope & Central Asia (excluding high income)Europe & Central Asia (IDA & IBRD countries)European UnionFaroe IslandsFijiFinlandFragile and conflict affected situationsFranceFrench PolynesiaGabonGambia, TheGeorgiaGermanyGhanaGreeceGreenlandGrenadaGuatemalaGuineaGuinea-BissauGuyanaHaitiHeavily indebted poor countries (HIPC)High incomeHondurasHong Kong SAR, ChinaHungaryIBRD onlyIcelandIDA & IBRD totalIDA blendIDA onlyIDA totalIndiaIndonesiaIran, Islamic Rep.IraqIrelandIsraelItalyJamaicaJapanJordanKazakhstanKenyaKiribatiKorea, Rep.KuwaitKyrgyz RepublicLao PDRLate-demographic dividendLatin America & Caribbean Latin America & Caribbean (excluding high income)Latin America & the Caribbean (IDA & IBRD countries)LatviaLeast developed countries: UN classificationLebanonLesothoLiberiaLibyaLithuaniaLow & middle incomeLow incomeLower middle incomeLuxembourgMacao SAR, ChinaMacedonia, FYRMadagascarMalawiMalaysiaMaldivesMaliMaltaMauritaniaMauritiusMexicoMiddle East & North AfricaMiddle East & North Africa (excluding high income)Middle East & North Africa (IDA & IBRD countries)Middle incomeMoldovaMongoliaMoroccoMozambiqueMyanmarNamibiaNepalNetherlandsNew CaledoniaNew ZealandNicaraguaNigerNigeriaNorth AmericaNorwayOECD membersOmanOther small statesPacific island small statesPakistanPalauPanamaPapua New GuineaParaguayPeruPhilippinesPolandPortugalPost-demographic dividendPre-demographic dividendQatarRomaniaRussian FederationRwandaSamoaSao Tome and PrincipeSaudi ArabiaSenegalSerbiaSeychellesSierra LeoneSingaporeSlovak RepublicSloveniaSmall statesSolomon IslandsSomaliaSouth AfricaSouth AsiaSouth Asia (IDA & IBRD)SpainSri LankaSt. Kitts and NevisSt. LuciaSt. Vincent and the GrenadinesSub-Saharan Africa Sub-Saharan Africa (excluding high income)Sub-Saharan Africa (IDA & IBRD countries)SudanSurinameSwazilandSwedenSwitzerlandSyrian Arab RepublicTajikistanTanzaniaThailandTimor-LesteTogoTongaTrinidad and TobagoTunisiaTurkeyTurkmenistanTurks and Caicos IslandsTuvaluUgandaUkraineUnited Arab EmiratesUnited KingdomUnited StatesUpper middle incomeUruguayVanuatuVenezuela, RBVietnamVirgin Islands (U.S.)WorldYemen, Rep.ZambiaZimbabwe línea de tiempo (timeline):
En esta escala de tiempo se presenta un gráfico de 1963 y 2016 de Sri Lanka. Los datos de 1962 están ausentes. El número de observaciones reales por fecha: 49.
Fuente (nombre):
Indicadores del desarrollo mundial
Fuente (organización):
World Bank staff estimates from the Comtrade database maintained by the United Nations Statistics Division.
Categorías:
Energy & Mining, Private Sector, Trade
Se ha actualizado:
23 abr 2017 año
Los indicadores de los cambios de valor en los últimos años
Mínimo:
0.897
1 ene 1975 año
Máximo:
3.485
1 ene 2006 año
A la fecha de observación
Valor
Cambio absoluto
El cambio con respecto al valor anterior
1 ene 1963 año
1.699
+1.699
0.0%
1 ene 1964 año
1.739
+0.041
2.39%
1 ene 1965 año
1.394
-0.345
-19.85%
1 ene 1966 año
2.142
+0.748
53.69%
1 ene 1967 año
1.456
-0.687
-32.05%
1 ene 1968 año
2.26
+0.805
55.27%
1 ene 1969 año
1.407
-0.853
-37.74%
1 ene 1970 año
1.917
+0.51
36.24%
1 ene 1971 año
1.381
-0.536
-27.96%
1 ene 1972 año
1.812
+0.431
31.22%
1 ene 1973 año
1.827
+0.015
0.84%
1 ene 1975 año
0.897
-0.931
-50.92%
1 ene 1976 año
0.932
+0.035
3.96%
1 ene 1977 año
1.492
+0.559
59.98%
1 ene 1978 año
1.047
-0.445
-29.83%
1 ene 1979 año
1.329
+0.282
26.96%
1 ene 1980 año
1.693
+0.365
27.44%
1 ene 1981 año
1.561
-0.132
-7.81%
1 ene 1982 año
1.462
-0.099
-6.35%
1 ene 1983 año
1.22
-0.242
-16.56%
1 ene 1984 año
1.265
+0.045
3.67%
1 ene 1985 año
1.198
-0.066
-5.24%
1 ene 1986 año
1.375
+0.177
14.74%
1 ene 1987 año
1.383
+0.008
0.61%
1 ene 1988 año
1.581
+0.198
14.28%
1 ene 1989 año
1.732
+0.151
9.52%
1 ene 1990 año
1.799
+0.068
3.91%
1 ene 1991 año
1.497
-0.302
-16.81%
1 ene 1992 año
1.408
-0.089
-5.91%
1 ene 1993 año
1.223
-0.185
-13.15%
1 ene 1994 año
1.24
+0.017
1.4%
1 ene 1995 año
1.106
-0.134
-10.8%
1 ene 2000 año
1.05
-0.056
-5.09%
1 ene 2001 año
1.105
+0.055
5.27%
1 ene 2002 año
1.122
+0.017
1.52%
1 ene 2003 año
2.021
+0.899
80.14%
1 ene 2004 año
2.505
+0.483
23.91%
1 ene 2005 año
3.066
+0.561
22.4%
1 ene 2006 año
3.485
+0.419
13.66%
1 ene 2007 año
2.937
-0.548
-15.73%
1 ene 2008 año
1.834
-1.102
-37.54%
1 ene 2009 año
1.711
-0.123
-6.71%
1 ene 2010 año
1.394
-0.317
-18.54%
1 ene 2011 año
1.803
+0.409
29.35%
1 ene 2012 año
1.462
-0.341
-18.9%
1 ene 2013 año
1.381
-0.081
-5.56%
1 ene 2014 año
1.485
+0.104
7.55%
1 ene 2015 año
1.443
-0.042
-2.82%
1 ene 2016 año
1.358
-0.085
-5.87%
Ranking de los países por los datos estadísticos actuales


Comentarios: