29
/es/
es
AIzaSyAYiBZKx7MnpbEhh9jyipgxe19OcubqV5w
April 1, 2024
165284
Jordan
JOR
true
2
1
Ores and metals imports (% of merchandise imports)
2016,2015,2014,2013,2012,2011,2010,2009,2008,2007,2006,2005,2004,2003,2002,2001,2000,1999,1998,1996,1995,1994,1993,1992,1991,1990,1989,1988,1987,1986,1985,1984,1983,1982,1981,1980,1979,1978,1977,1976,1975,1974,1973,1972,1971,1970,1969,1968,1967,1966,1965
Estas estadísticas en otros países:
AfghanistanAlbaniaAlgeriaAndorraAngolaAntigua and BarbudaArab WorldArgentinaArmeniaArubaAustraliaAustriaAzerbaijanBahamas, TheBahrainBangladeshBarbadosBelarusBelgiumBelizeBeninBermudaBhutanBoliviaBosnia and HerzegovinaBotswanaBrazilBrunei DarussalamBulgariaBurkina FasoBurundiCabo VerdeCambodiaCameroonCanadaCaribbean small statesCayman IslandsCentral African RepublicCentral Europe and the BalticsChadChileChinaColombiaComorosCongo, Dem. Rep.Congo, Rep.Costa RicaCote d'IvoireCroatiaCubaCyprusCzech RepublicDenmarkDjiboutiDominicaDominican RepublicEarly-demographic dividendEast Asia & PacificEast Asia & Pacific (excluding high income)East Asia & Pacific (IDA & IBRD countries)EcuadorEgypt, Arab Rep.El SalvadorEquatorial GuineaEritreaEstoniaEthiopiaEuro areaEurope & Central AsiaEurope & Central Asia (excluding high income)Europe & Central Asia (IDA & IBRD countries)European UnionFaroe IslandsFijiFinlandFragile and conflict affected situationsFranceFrench PolynesiaGabonGambia, TheGeorgiaGermanyGhanaGreeceGreenlandGrenadaGuatemalaGuineaGuinea-BissauGuyanaHaitiHeavily indebted poor countries (HIPC)High incomeHondurasHong Kong SAR, ChinaHungaryIBRD onlyIcelandIDA & IBRD totalIDA blendIDA onlyIDA totalIndiaIndonesiaIran, Islamic Rep.IraqIrelandIsraelItalyJamaicaJapanJordanKazakhstanKenyaKiribatiKorea, Rep.KuwaitKyrgyz RepublicLao PDRLate-demographic dividendLatin America & Caribbean Latin America & Caribbean (excluding high income)Latin America & the Caribbean (IDA & IBRD countries)LatviaLeast developed countries: UN classificationLebanonLesothoLiberiaLibyaLithuaniaLow & middle incomeLow incomeLower middle incomeLuxembourgMacao SAR, ChinaMacedonia, FYRMadagascarMalawiMalaysiaMaldivesMaliMaltaMauritaniaMauritiusMexicoMiddle East & North AfricaMiddle East & North Africa (excluding high income)Middle East & North Africa (IDA & IBRD countries)Middle incomeMoldovaMongoliaMoroccoMozambiqueMyanmarNamibiaNepalNetherlandsNew CaledoniaNew ZealandNicaraguaNigerNigeriaNorth AmericaNorwayOECD membersOmanOther small statesPacific island small statesPakistanPalauPanamaPapua New GuineaParaguayPeruPhilippinesPolandPortugalPost-demographic dividendPre-demographic dividendQatarRomaniaRussian FederationRwandaSamoaSao Tome and PrincipeSaudi ArabiaSenegalSerbiaSeychellesSierra LeoneSingaporeSlovak RepublicSloveniaSmall statesSolomon IslandsSomaliaSouth AfricaSouth AsiaSouth Asia (IDA & IBRD)SpainSri LankaSt. Kitts and NevisSt. LuciaSt. Vincent and the GrenadinesSub-Saharan Africa Sub-Saharan Africa (excluding high income)Sub-Saharan Africa (IDA & IBRD countries)SudanSurinameSwazilandSwedenSwitzerlandSyrian Arab RepublicTajikistanTanzaniaThailandTimor-LesteTogoTongaTrinidad and TobagoTunisiaTurkeyTurkmenistanTurks and Caicos IslandsTuvaluUgandaUkraineUnited Arab EmiratesUnited KingdomUnited StatesUpper middle incomeUruguayVanuatuVenezuela, RBVietnamVirgin Islands (U.S.)WorldYemen, Rep.ZambiaZimbabwe línea de tiempo (timeline):
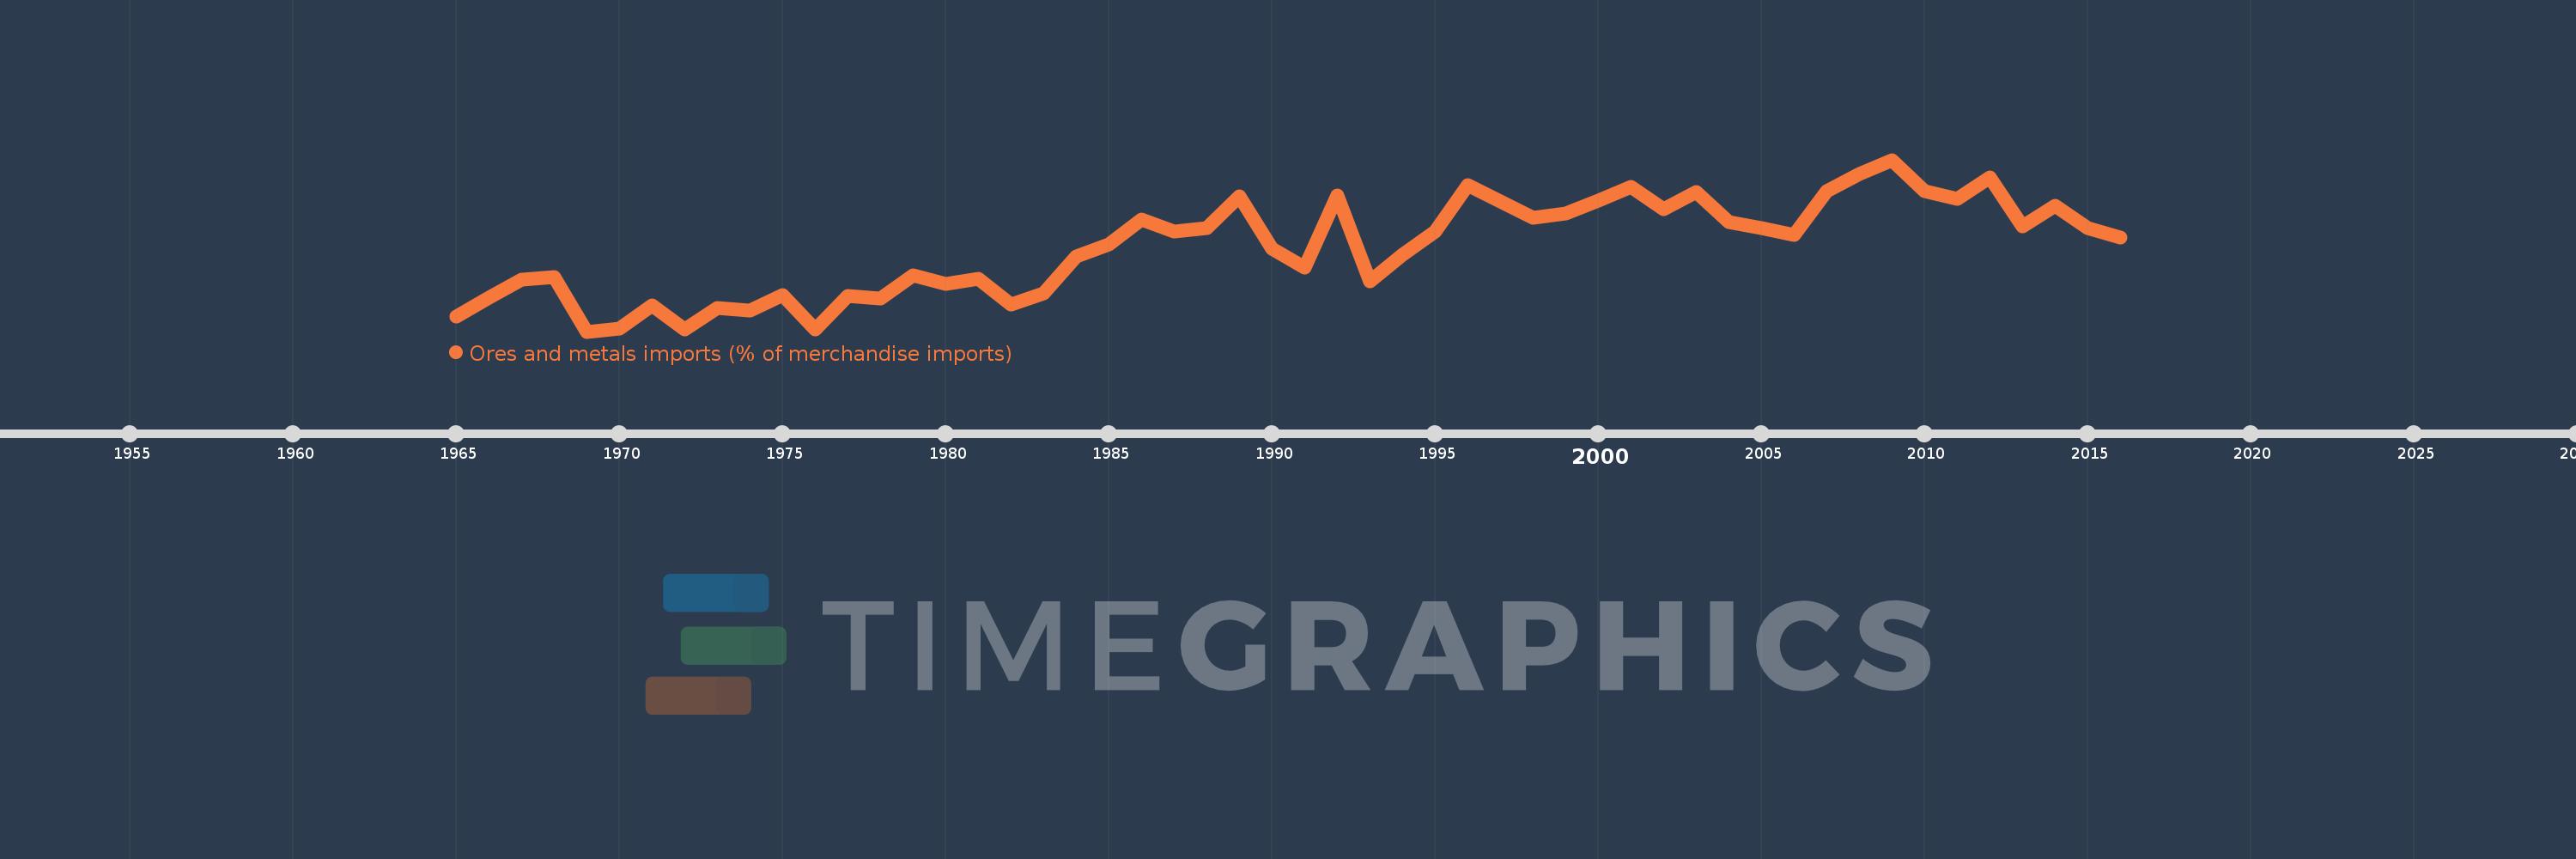
En esta escala de tiempo se presenta un gráfico de 1965 y 2016 de Jordan. Los datos de 1964 están ausentes. El número de observaciones reales por fecha: 51.
Fuente (nombre):
Indicadores del desarrollo mundial
Fuente (organización):
World Bank staff estimates from the Comtrade database maintained by the United Nations Statistics Division.
Categorías:
Energy & Mining, Private Sector, Trade
Se ha actualizado:
23 abr 2017 año
Los indicadores de los cambios de valor en los últimos años
Mínimo:
0.649
1 ene 1969 año
Máximo:
2.848
1 ene 2009 año
A la fecha de observación
Valor
Cambio absoluto
El cambio con respecto al valor anterior
1 ene 1965 año
0.843
+0.843
0.0%
1 ene 1966 año
1.083
+0.239
28.4%
1 ene 1967 año
1.31
+0.228
21.04%
1 ene 1968 año
1.342
+0.031
2.4%
1 ene 1969 año
0.649
-0.693
-51.67%
1 ene 1970 año
0.69
+0.041
6.35%
1 ene 1971 año
0.979
+0.289
41.92%
1 ene 1972 año
0.675
-0.304
-31.07%
1 ene 1973 año
0.952
+0.277
41.08%
1 ene 1974 año
0.914
-0.038
-3.95%
1 ene 1975 año
1.118
+0.204
22.32%
1 ene 1976 año
0.679
-0.44
-39.33%
1 ene 1977 año
1.107
+0.429
63.22%
1 ene 1978 año
1.074
-0.033
-2.98%
1 ene 1979 año
1.367
+0.293
27.25%
1 ene 1980 año
1.264
-0.103
-7.56%
1 ene 1981 año
1.328
+0.064
5.06%
1 ene 1982 año
0.993
-0.335
-25.2%
1 ene 1983 año
1.136
+0.142
14.35%
1 ene 1984 año
1.614
+0.479
42.17%
1 ene 1985 año
1.76
+0.146
9.03%
1 ene 1986 año
2.089
+0.329
18.67%
1 ene 1987 año
1.93
-0.159
-7.63%
1 ene 1988 año
1.976
+0.046
2.4%
1 ene 1989 año
2.384
+0.408
20.67%
1 ene 1990 año
1.706
-0.678
-28.46%
1 ene 1991 año
1.468
-0.238
-13.96%
1 ene 1992 año
2.391
+0.924
62.94%
1 ene 1993 año
1.295
-1.096
-45.83%
1 ene 1994 año
1.632
+0.336
25.95%
1 ene 1995 año
1.935
+0.303
18.59%
1 ene 1996 año
2.519
+0.584
30.18%
1 ene 1998 año
2.101
-0.418
-16.58%
1 ene 1999 año
2.161
+0.059
2.83%
1 ene 2000 año
2.322
+0.162
7.48%
1 ene 2001 año
2.497
+0.175
7.52%
1 ene 2002 año
2.218
-0.279
-11.18%
1 ene 2003 año
2.44
+0.223
10.04%
1 ene 2004 año
2.052
-0.388
-15.89%
1 ene 2005 año
1.979
-0.074
-3.58%
1 ene 2006 año
1.887
-0.092
-4.63%
1 ene 2007 año
2.449
+0.561
29.74%
1 ene 2008 año
2.672
+0.224
9.13%
1 ene 2009 año
2.848
+0.175
6.56%
1 ene 2010 año
2.449
-0.398
-13.99%
1 ene 2011 año
2.345
-0.104
-4.26%
1 ene 2012 año
2.62
+0.275
11.72%
1 ene 2013 año
1.991
-0.629
-23.99%
1 ene 2014 año
2.258
+0.267
13.4%
1 ene 2015 año
1.979
-0.279
-12.36%
1 ene 2016 año
1.858
-0.121
-6.11%
Ranking de los países por los datos estadísticos actuales


Comentarios: