30
/es/
AIzaSyAYiBZKx7MnpbEhh9jyipgxe19OcubqV5w
April 1, 2024
176830
Lebanon
LBN
true
2
1
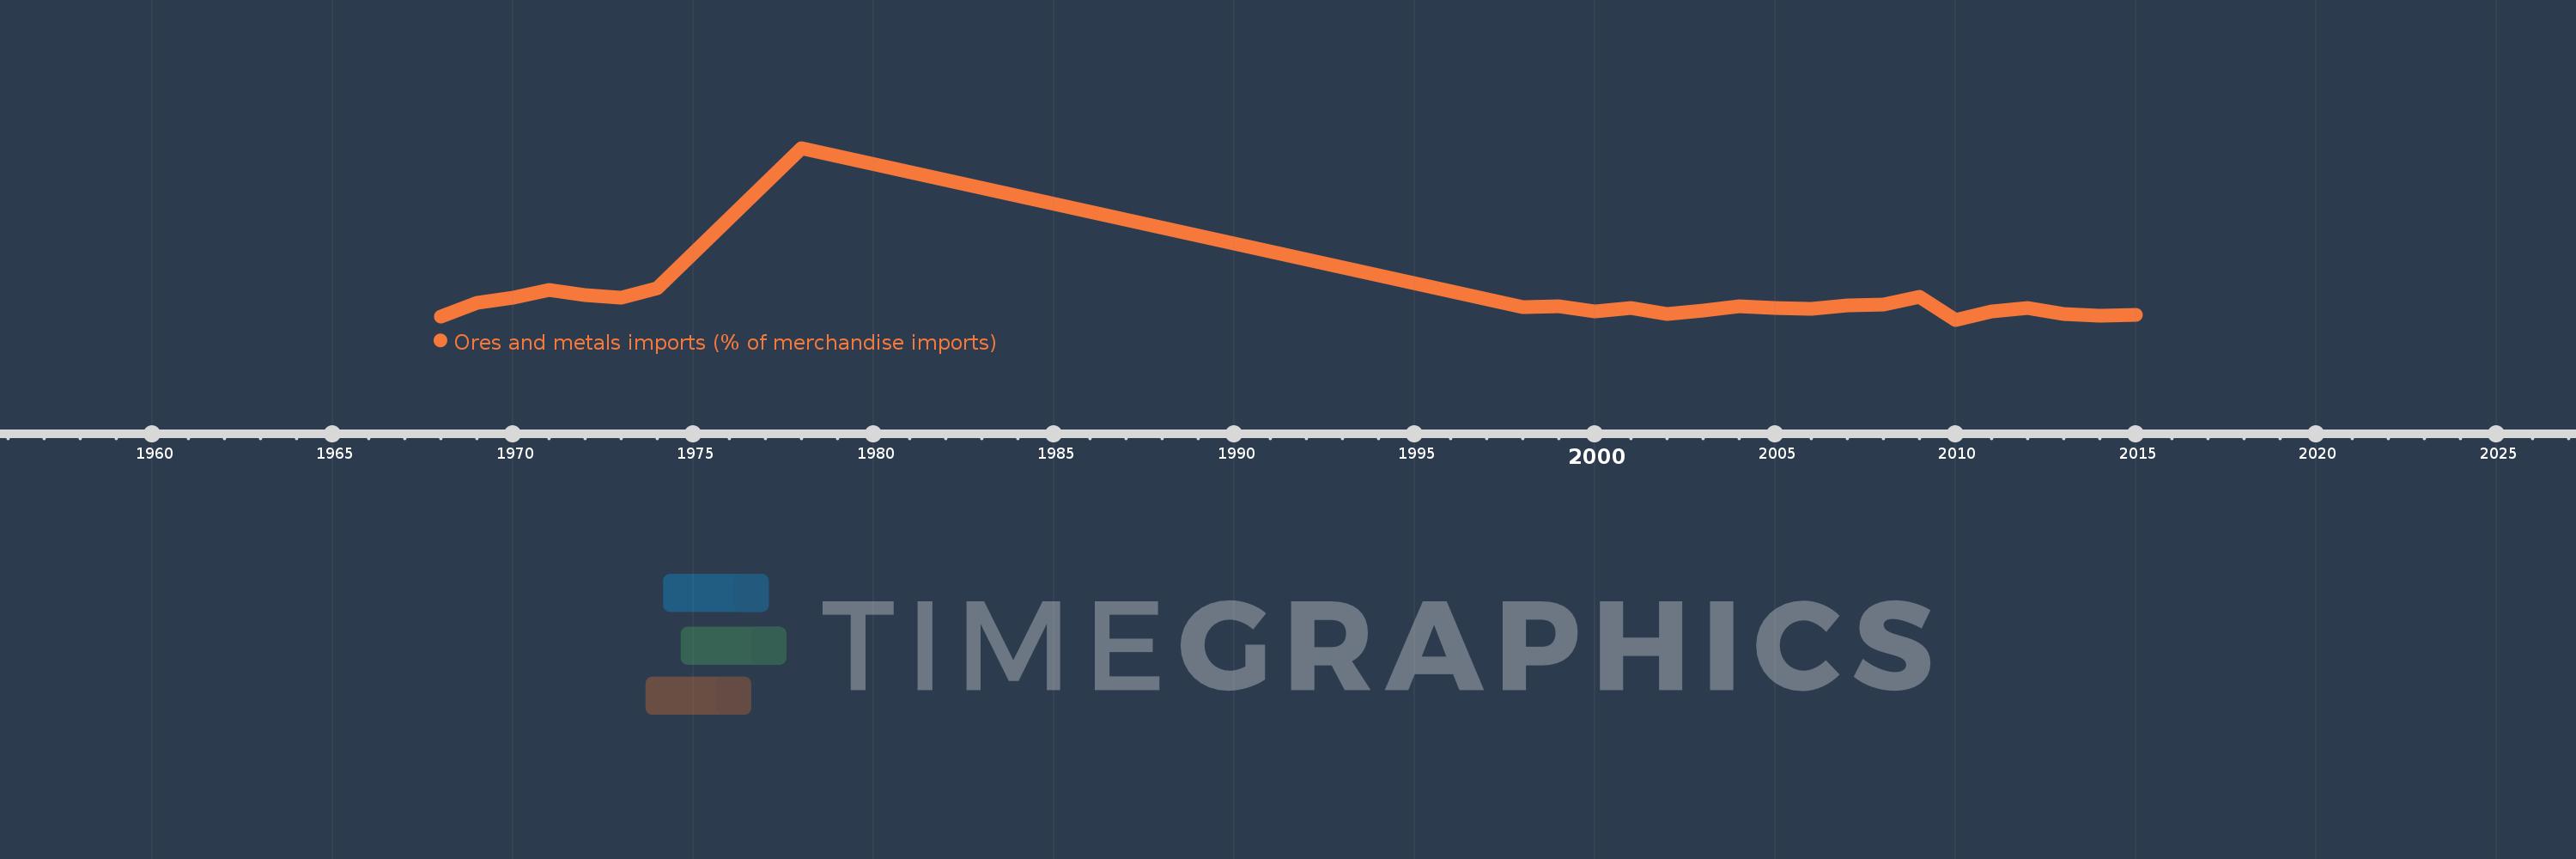
Ores and metals imports (% of merchandise imports)
2015,2014,2013,2012,2011,2010,2009,2008,2007,2006,2005,2004,2003,2002,2001,2000,1999,1998,1978,1974,1973,1972,1971,1970,1969,1968
