29
/es/
es
AIzaSyAYiBZKx7MnpbEhh9jyipgxe19OcubqV5w
April 1, 2024
74152
Austria
AUT
true
2
1
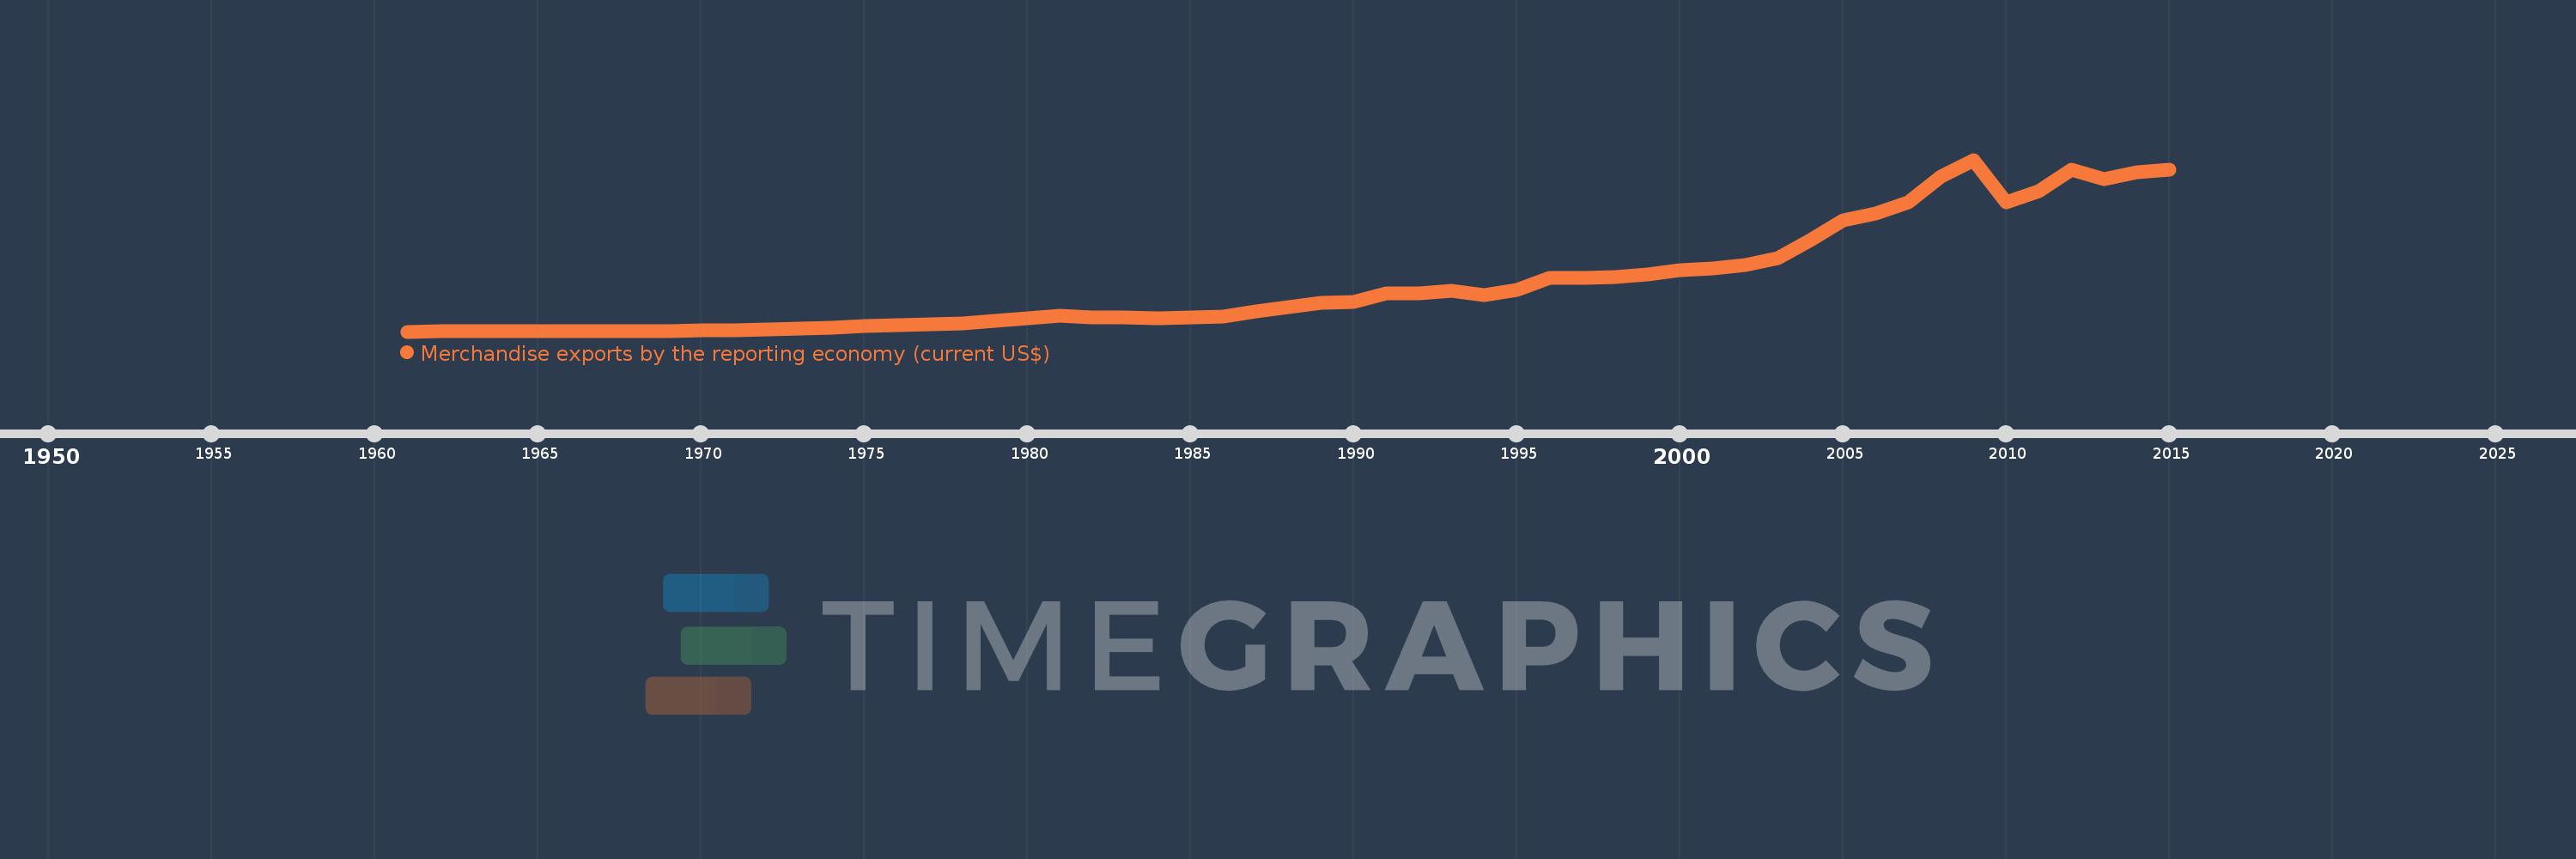
Merchandise exports by the reporting economy (current US$)
2015,2014,2013,2012,2011,2010,2009,2008,2007,2006,2005,2004,2003,2002,2001,2000,1999,1998,1997,1996,1995,1994,1993,1992,1991,1990,1989,1988,1987,1986,1985,1984,1983,1982,1981,1980,1979,1978,1977,1976,1975,1974,1973,1972,1971,1970,1969,1968,1967,1966,1965,1964,1963,1962,1961
Estas estadísticas en otros países:
AfghanistanAlbaniaAlgeriaAmerican SamoaAngolaAntigua and BarbudaArab WorldArgentinaArmeniaArubaAustraliaAustriaAzerbaijanBahamas, TheBahrainBangladeshBarbadosBelarusBelgiumBelizeBeninBermudaBoliviaBosnia and HerzegovinaBrazilBrunei DarussalamBulgariaBurkina FasoBurundiCabo VerdeCambodiaCameroonCanadaCaribbean small statesCentral African RepublicCentral Europe and the BalticsChadChileChinaColombiaComorosCongo, Dem. Rep.Congo, Rep.Costa RicaCote d'IvoireCroatiaCubaCyprusCzech RepublicDenmarkDjiboutiDominicaDominican RepublicEarly-demographic dividendEast Asia & PacificEast Asia & Pacific (excluding high income)East Asia & Pacific (IDA & IBRD countries)EcuadorEgypt, Arab Rep.El SalvadorEquatorial GuineaEstoniaEthiopiaEuro areaEurope & Central AsiaEurope & Central Asia (excluding high income)Europe & Central Asia (IDA & IBRD countries)European UnionFaroe IslandsFijiFinlandFragile and conflict affected situationsFranceFrench PolynesiaGabonGambia, TheGeorgiaGermanyGhanaGibraltarGreeceGreenlandGrenadaGuamGuatemalaGuineaGuinea-BissauGuyanaHaitiHeavily indebted poor countries (HIPC)High incomeHondurasHong Kong SAR, ChinaHungaryIBRD onlyIcelandIDA & IBRD totalIDA blendIDA onlyIDA totalIndiaIndonesiaIran, Islamic Rep.IraqIrelandIsraelItalyJamaicaJapanJordanKazakhstanKenyaKiribatiKorea, Dem. People’s Rep.Korea, Rep.KosovoKuwaitKyrgyz RepublicLao PDRLate-demographic dividendLatin America & Caribbean Latin America & Caribbean (excluding high income)Latin America & the Caribbean (IDA & IBRD countries)LatviaLeast developed countries: UN classificationLebanonLiberiaLibyaLithuaniaLow & middle incomeLow incomeLower middle incomeLuxembourgMacao SAR, ChinaMacedonia, FYRMadagascarMalawiMalaysiaMaldivesMaliMaltaMauritaniaMauritiusMexicoMiddle East & North AfricaMiddle East & North Africa (excluding high income)Middle East & North Africa (IDA & IBRD countries)Middle incomeMoldovaMongoliaMontenegroMoroccoMozambiqueMyanmarNauruNepalNetherlandsNew CaledoniaNew ZealandNicaraguaNigerNigeriaNorth AmericaNorwayOECD membersOmanOther small statesPacific island small statesPakistanPanamaPapua New GuineaParaguayPeruPhilippinesPolandPortugalPost-demographic dividendPre-demographic dividendQatarRomaniaRussian FederationRwandaSamoaSao Tome and PrincipeSaudi ArabiaSenegalSerbiaSeychellesSierra LeoneSingaporeSlovak RepublicSloveniaSmall statesSolomon IslandsSomaliaSouth AfricaSouth AsiaSouth Asia (IDA & IBRD)SpainSri LankaSt. Kitts and NevisSt. LuciaSt. Vincent and the GrenadinesSub-Saharan Africa Sub-Saharan Africa (excluding high income)Sub-Saharan Africa (IDA & IBRD countries)SudanSurinameSwedenSwitzerlandSyrian Arab RepublicTajikistanTanzaniaThailandTogoTongaTrinidad and TobagoTunisiaTurkeyTurkmenistanTuvaluUgandaUkraineUnited Arab EmiratesUnited KingdomUnited StatesUpper middle incomeUruguayUzbekistanVanuatuVenezuela, RBVietnamWorldYemen, Rep.ZambiaZimbabwe línea de tiempo (timeline):
En esta escala de tiempo se presenta un gráfico de 1961 y 2015 de Austria. Los datos de 1960 están ausentes. El número de observaciones reales por fecha: 55.
Fuente (nombre):
Indicadores del desarrollo mundial
Fuente (organización):
World Bank staff estimates based data from International Monetary Fund's Direction of Trade database.
Categorías:
Private Sector, Trade
Se ha actualizado:
23 abr 2017 año
Los indicadores de los cambios de valor en los últimos años
Mínimo:
1.119 bn
1 ene 1961 año
Máximo:
181.736 bn
1 ene 2009 año
A la fecha de observación
Valor
Cambio absoluto
El cambio con respecto al valor anterior
1 ene 1961 año
1.119 bn
+1.119 bn
0.0%
1 ene 1962 año
1.2 bn
+81.1 millones
7.25%
1 ene 1963 año
1.261 bn
+61.3 millones
5.11%
1 ene 1964 año
1.322 bn
+61.0 millones
4.84%
1 ene 1965 año
1.439 bn
+116.6 millones
8.82%
1 ene 1966 año
1.596 bn
+156.7 millones
10.89%
1 ene 1967 año
1.683 bn
+87.0 millones
5.45%
1 ene 1968 año
1.81 bn
+127.2 millones
7.56%
1 ene 1969 año
1.99 bn
+180.1 millones
9.95%
1 ene 1970 año
2.412 bn
+422.0 millones
21.21%
1 ene 1971 año
2.849 bn
+436.9 millones
18.11%
1 ene 1972 año
3.163 bn
+314.7 millones
11.05%
1 ene 1973 año
3.874 bn
+710.9 millones
22.47%
1 ene 1974 año
5.278 bn
+1.404 bn
36.23%
1 ene 1975 año
7.153 bn
+1.875 bn
35.52%
1 ene 1976 año
7.513 bn
+360.4 millones
5.04%
1 ene 1977 año
8.498 bn
+985.0 millones
13.11%
1 ene 1978 año
9.802 bn
+1.304 bn
15.34%
1 ene 1979 año
12.196 bn
+2.394 bn
24.42%
1 ene 1980 año
15.47 bn
+3.274 bn
26.84%
1 ene 1981 año
17.482 bn
+2.012 bn
13.01%
1 ene 1982 año
15.832 bn
-1.65 bn
-9.44%
1 ene 1983 año
15.634 bn
-198.7 millones
-1.26%
1 ene 1984 año
15.423 bn
-210.3 millones
-1.35%
1 ene 1985 año
15.738 bn
+314.8 millones
2.04%
1 ene 1986 año
17.231 bn
+1.493 bn
9.49%
1 ene 1987 año
22.473 bn
+5.242 bn
30.42%
1 ene 1988 año
27.168 bn
+4.694 bn
20.89%
1 ene 1989 año
31.035 bn
+3.867 bn
14.24%
1 ene 1990 año
32.447 bn
+1.412 bn
4.55%
1 ene 1991 año
41.391 bn
+8.944 bn
27.56%
1 ene 1992 año
41.115 bn
-276.123 millones
-0.67%
1 ene 1993 año
44.405 bn
+3.291 bn
8.0%
1 ene 1994 año
39.658 bn
-4.748 bn
-10.69%
1 ene 1995 año
45.026 bn
+5.369 bn
13.54%
1 ene 1996 año
57.535 bn
+12.509 bn
27.78%
1 ene 1997 año
57.826 bn
+290.83 millones
0.51%
1 ene 1998 año
58.688 bn
+862.235 millones
1.49%
1 ene 1999 año
61.426 bn
+2.737 bn
4.66%
1 ene 2000 año
65.954 bn
+4.529 bn
7.37%
1 ene 2001 año
67.456 bn
+1.501 bn
2.28%
1 ene 2002 año
70.743 bn
+3.287 bn
4.87%
1 ene 2003 año
78.515 bn
+7.772 bn
10.99%
1 ene 2004 año
97.18 bn
+18.665 bn
23.77%
1 ene 2005 año
118.32 bn
+21.14 bn
21.75%
1 ene 2006 año
125.013 bn
+6.693 bn
5.66%
1 ene 2007 año
136.866 bn
+11.853 bn
9.48%
1 ene 2008 año
163.804 bn
+26.938 bn
19.68%
1 ene 2009 año
181.736 bn
+17.932 bn
10.95%
1 ene 2010 año
137.087 bn
-44.65 bn
-24.57%
1 ene 2011 año
148.635 bn
+11.548 bn
8.42%
1 ene 2012 año
171.783 bn
+23.148 bn
15.57%
1 ene 2013 año
161.244 bn
-10.539 bn
-6.14%
1 ene 2014 año
168.809 bn
+7.565 bn
4.69%
1 ene 2015 año
171.076 bn
+2.267 bn
1.34%
Ranking de los países por los datos estadísticos actuales


Comentarios: