29
/es/
es
AIzaSyAYiBZKx7MnpbEhh9jyipgxe19OcubqV5w
April 1, 2024
257549
Switzerland
CHE
true
2
1
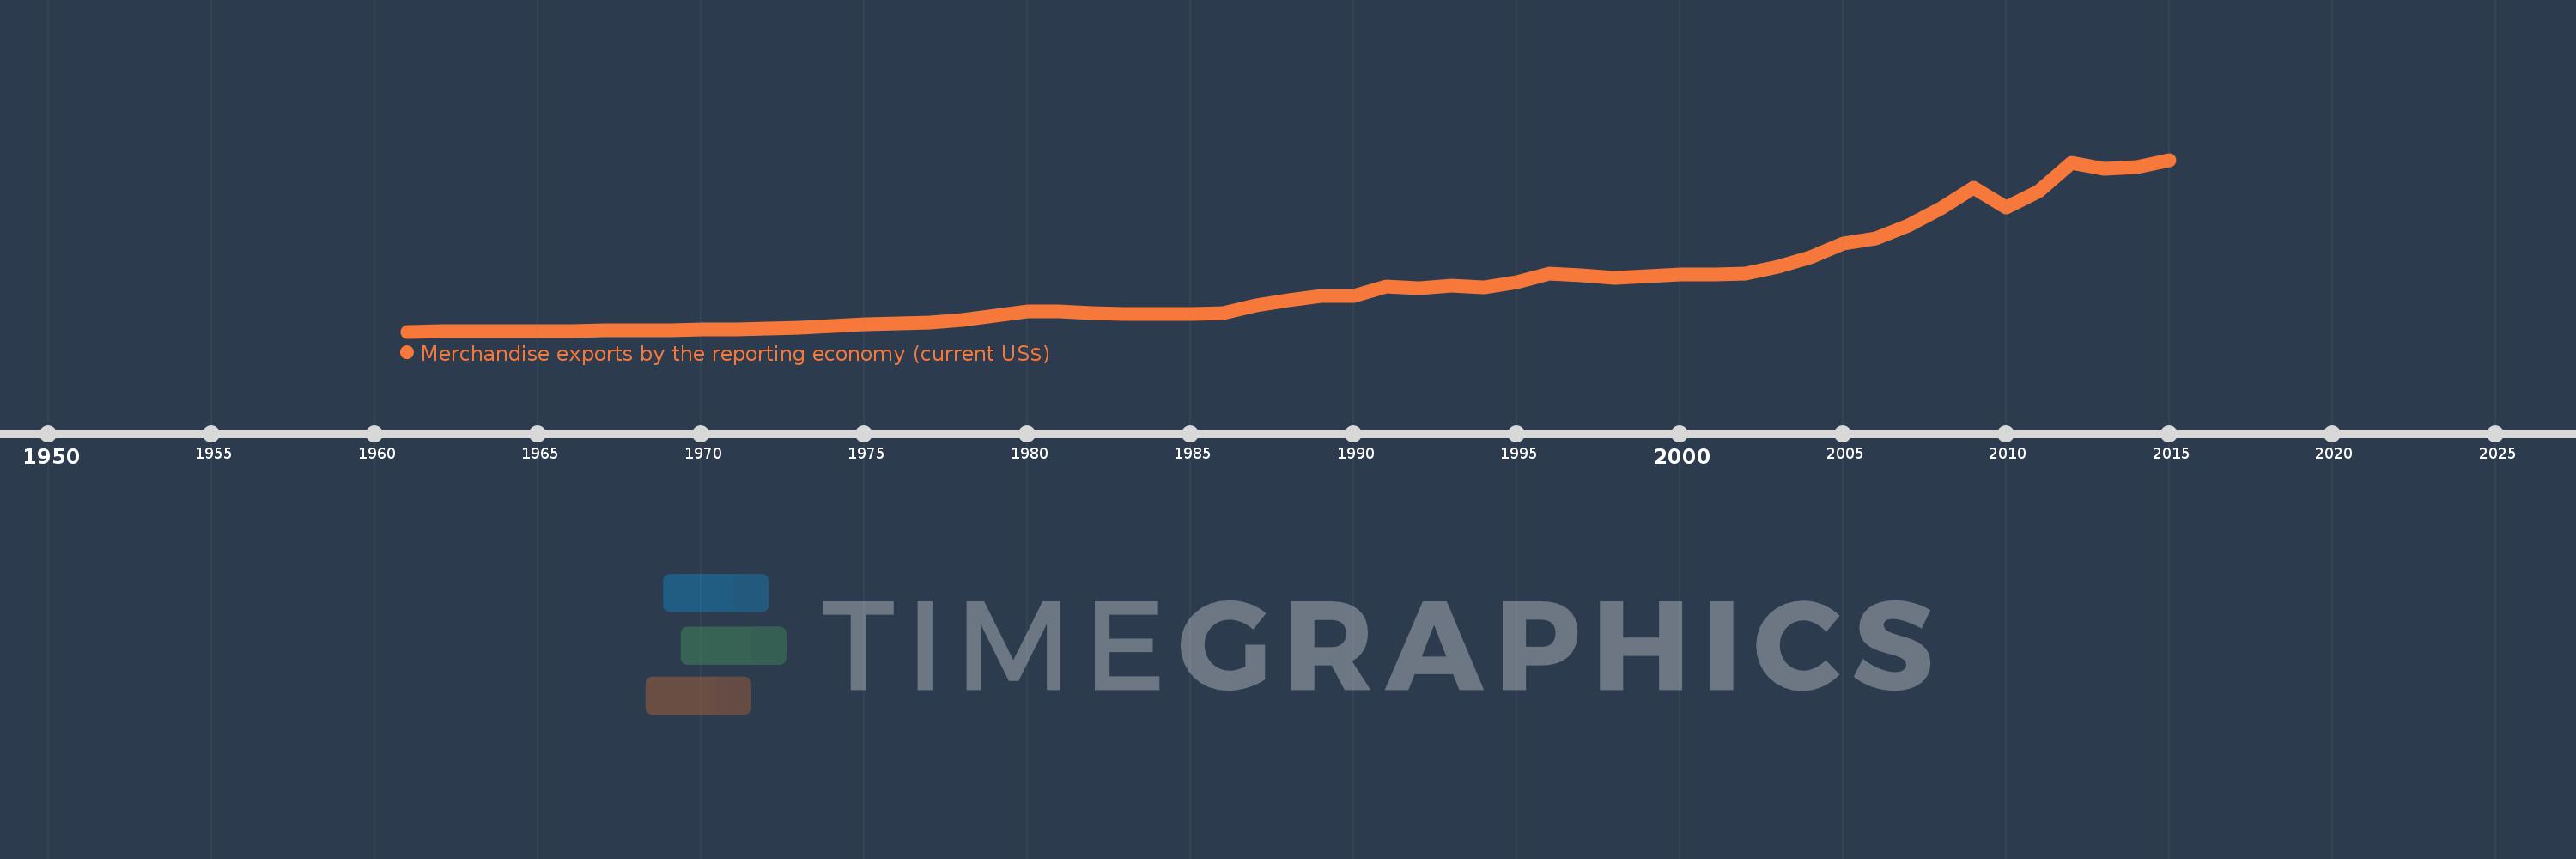
Merchandise exports by the reporting economy (current US$)
2015,2014,2013,2012,2011,2010,2009,2008,2007,2006,2005,2004,2003,2002,2001,2000,1999,1998,1997,1996,1995,1994,1993,1992,1991,1990,1989,1988,1987,1986,1985,1984,1983,1982,1981,1980,1979,1978,1977,1976,1975,1974,1973,1972,1971,1970,1969,1968,1967,1966,1965,1964,1963,1962,1961
Estas estadísticas en otros países:
AfghanistanAlbaniaAlgeriaAmerican SamoaAngolaAntigua and BarbudaArab WorldArgentinaArmeniaArubaAustraliaAustriaAzerbaijanBahamas, TheBahrainBangladeshBarbadosBelarusBelgiumBelizeBeninBermudaBoliviaBosnia and HerzegovinaBrazilBrunei DarussalamBulgariaBurkina FasoBurundiCabo VerdeCambodiaCameroonCanadaCaribbean small statesCentral African RepublicCentral Europe and the BalticsChadChileChinaColombiaComorosCongo, Dem. Rep.Congo, Rep.Costa RicaCote d'IvoireCroatiaCubaCyprusCzech RepublicDenmarkDjiboutiDominicaDominican RepublicEarly-demographic dividendEast Asia & PacificEast Asia & Pacific (excluding high income)East Asia & Pacific (IDA & IBRD countries)EcuadorEgypt, Arab Rep.El SalvadorEquatorial GuineaEstoniaEthiopiaEuro areaEurope & Central AsiaEurope & Central Asia (excluding high income)Europe & Central Asia (IDA & IBRD countries)European UnionFaroe IslandsFijiFinlandFragile and conflict affected situationsFranceFrench PolynesiaGabonGambia, TheGeorgiaGermanyGhanaGibraltarGreeceGreenlandGrenadaGuamGuatemalaGuineaGuinea-BissauGuyanaHaitiHeavily indebted poor countries (HIPC)High incomeHondurasHong Kong SAR, ChinaHungaryIBRD onlyIcelandIDA & IBRD totalIDA blendIDA onlyIDA totalIndiaIndonesiaIran, Islamic Rep.IraqIrelandIsraelItalyJamaicaJapanJordanKazakhstanKenyaKiribatiKorea, Dem. People’s Rep.Korea, Rep.KosovoKuwaitKyrgyz RepublicLao PDRLate-demographic dividendLatin America & Caribbean Latin America & Caribbean (excluding high income)Latin America & the Caribbean (IDA & IBRD countries)LatviaLeast developed countries: UN classificationLebanonLiberiaLibyaLithuaniaLow & middle incomeLow incomeLower middle incomeLuxembourgMacao SAR, ChinaMacedonia, FYRMadagascarMalawiMalaysiaMaldivesMaliMaltaMauritaniaMauritiusMexicoMiddle East & North AfricaMiddle East & North Africa (excluding high income)Middle East & North Africa (IDA & IBRD countries)Middle incomeMoldovaMongoliaMontenegroMoroccoMozambiqueMyanmarNauruNepalNetherlandsNew CaledoniaNew ZealandNicaraguaNigerNigeriaNorth AmericaNorwayOECD membersOmanOther small statesPacific island small statesPakistanPanamaPapua New GuineaParaguayPeruPhilippinesPolandPortugalPost-demographic dividendPre-demographic dividendQatarRomaniaRussian FederationRwandaSamoaSao Tome and PrincipeSaudi ArabiaSenegalSerbiaSeychellesSierra LeoneSingaporeSlovak RepublicSloveniaSmall statesSolomon IslandsSomaliaSouth AfricaSouth AsiaSouth Asia (IDA & IBRD)SpainSri LankaSt. Kitts and NevisSt. LuciaSt. Vincent and the GrenadinesSub-Saharan Africa Sub-Saharan Africa (excluding high income)Sub-Saharan Africa (IDA & IBRD countries)SudanSurinameSwedenSwitzerlandSyrian Arab RepublicTajikistanTanzaniaThailandTogoTongaTrinidad and TobagoTunisiaTurkeyTurkmenistanTuvaluUgandaUkraineUnited Arab EmiratesUnited KingdomUnited StatesUpper middle incomeUruguayUzbekistanVanuatuVenezuela, RBVietnamWorldYemen, Rep.ZambiaZimbabwe línea de tiempo (timeline):
En esta escala de tiempo se presenta un gráfico de 1961 y 2015 de Switzerland. Los datos de 1960 están ausentes. El número de observaciones reales por fecha: 55.
Fuente (nombre):
Indicadores del desarrollo mundial
Fuente (organización):
World Bank staff estimates based data from International Monetary Fund's Direction of Trade database.
Categorías:
Private Sector, Trade
Se ha actualizado:
23 abr 2017 año
Los indicadores de los cambios de valor en los últimos años
Mínimo:
1.885 bn
1 ene 1961 año
Máximo:
238.905 bn
1 ene 2015 año
A la fecha de observación
Valor
Cambio absoluto
El cambio con respecto al valor anterior
1 ene 1961 año
1.885 bn
+1.885 bn
0.0%
1 ene 1962 año
2.044 bn
+158.8 millones
8.42%
1 ene 1963 año
2.225 bn
+180.7 millones
8.84%
1 ene 1964 año
2.419 bn
+193.9 millones
8.71%
1 ene 1965 año
2.646 bn
+227.5 millones
9.41%
1 ene 1966 año
2.967 bn
+320.3 millones
12.1%
1 ene 1967 año
3.287 bn
+320.0 millones
10.79%
1 ene 1968 año
3.508 bn
+221.1 millones
6.73%
1 ene 1969 año
4.013 bn
+505.4 millones
14.41%
1 ene 1970 año
4.638 bn
+625.3 millones
15.58%
1 ene 1971 año
5.157 bn
+518.2 millones
11.17%
1 ene 1972 año
5.752 bn
+595.5 millones
11.55%
1 ene 1973 año
6.873 bn
+1.121 bn
19.48%
1 ene 1974 año
9.552 bn
+2.679 bn
38.98%
1 ene 1975 año
11.935 bn
+2.384 bn
24.96%
1 ene 1976 año
12.95 bn
+1.015 bn
8.51%
1 ene 1977 año
14.845 bn
+1.895 bn
14.63%
1 ene 1978 año
17.607 bn
+2.762 bn
18.61%
1 ene 1979 año
23.576 bn
+5.969 bn
33.9%
1 ene 1980 año
29.838 bn
+6.261 bn
26.56%
1 ene 1981 año
29.644 bn
-193.4 millones
-0.65%
1 ene 1982 año
27.039 bn
-2.605 bn
-8.79%
1 ene 1983 año
26.015 bn
-1.024 bn
-3.79%
1 ene 1984 año
25.588 bn
-427.0 millones
-1.64%
1 ene 1985 año
25.85 bn
+262.2 millones
1.02%
1 ene 1986 año
27.448 bn
+1.598 bn
6.18%
1 ene 1987 año
37.459 bn
+10.011 bn
36.47%
1 ene 1988 año
45.505 bn
+8.046 bn
21.48%
1 ene 1989 año
50.632 bn
+5.127 bn
11.27%
1 ene 1990 año
51.557 bn
+924.646 millones
1.83%
1 ene 1991 año
63.804 bn
+12.248 bn
23.76%
1 ene 1992 año
61.393 bn
-2.411 bn
-3.78%
1 ene 1993 año
65.553 bn
+4.16 bn
6.78%
1 ene 1994 año
62.745 bn
-2.808 bn
-4.28%
1 ene 1995 año
70.489 bn
+7.744 bn
12.34%
1 ene 1996 año
81.379 bn
+10.891 bn
15.45%
1 ene 1997 año
79.411 bn
-1.969 bn
-2.42%
1 ene 1998 año
75.958 bn
-3.452 bn
-4.35%
1 ene 1999 año
78.849 bn
+2.891 bn
3.81%
1 ene 2000 año
80.251 bn
+1.402 bn
1.78%
1 ene 2001 año
80.537 bn
+286.215 millones
0.36%
1 ene 2002 año
82.063 bn
+1.526 bn
1.89%
1 ene 2003 año
91.698 bn
+9.635 bn
11.74%
1 ene 2004 año
104.821 bn
+13.123 bn
14.31%
1 ene 2005 año
122.844 bn
+18.023 bn
17.19%
1 ene 2006 año
130.898 bn
+8.054 bn
6.56%
1 ene 2007 año
147.719 bn
+16.821 bn
12.85%
1 ene 2008 año
171.824 bn
+24.105 bn
16.32%
1 ene 2009 año
200.334 bn
+28.51 bn
16.59%
1 ene 2010 año
172.64 bn
-27.694 bn
-13.82%
1 ene 2011 año
195.512 bn
+22.873 bn
13.25%
1 ene 2012 año
234.862 bn
+39.35 bn
20.13%
1 ene 2013 año
225.926 bn
-8.936 bn
-3.8%
1 ene 2014 año
229.038 bn
+3.112 bn
1.38%
1 ene 2015 año
238.905 bn
+9.866 bn
4.31%
Ranking de los países por los datos estadísticos actuales


Comentarios: