29
/es/
es
AIzaSyAYiBZKx7MnpbEhh9jyipgxe19OcubqV5w
April 1, 2024
53568
Other small states
OSS
false
2
1
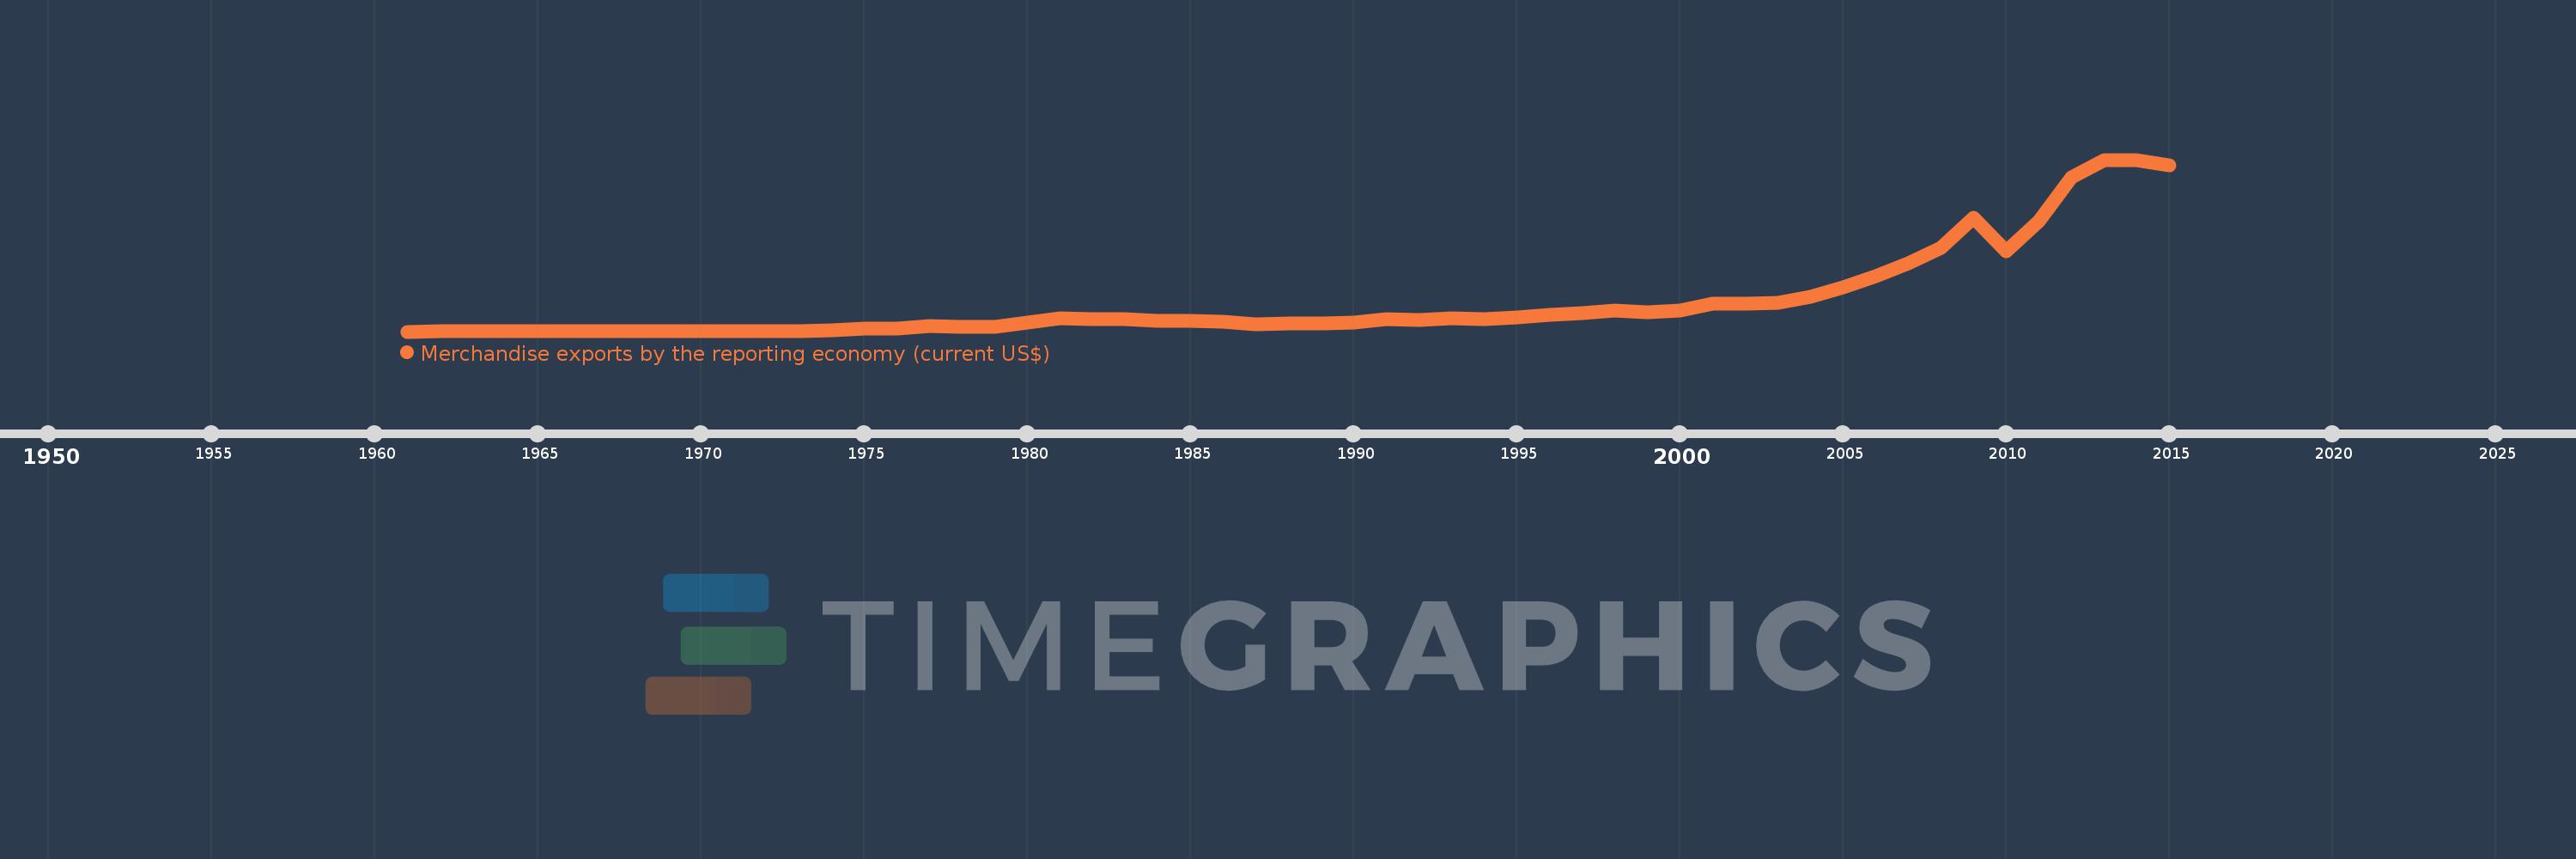
Merchandise exports by the reporting economy (current US$)
2015,2014,2013,2012,2011,2010,2009,2008,2007,2006,2005,2004,2003,2002,2001,2000,1999,1998,1997,1996,1995,1994,1993,1992,1991,1990,1989,1988,1987,1986,1985,1984,1983,1982,1981,1980,1979,1978,1977,1976,1975,1974,1973,1972,1971,1970,1969,1968,1967,1966,1965,1964,1963,1962,1961
Estas estadísticas en otros países:
AfghanistanAlbaniaAlgeriaAmerican SamoaAngolaAntigua and BarbudaArab WorldArgentinaArmeniaArubaAustraliaAustriaAzerbaijanBahamas, TheBahrainBangladeshBarbadosBelarusBelgiumBelizeBeninBermudaBoliviaBosnia and HerzegovinaBrazilBrunei DarussalamBulgariaBurkina FasoBurundiCabo VerdeCambodiaCameroonCanadaCaribbean small statesCentral African RepublicCentral Europe and the BalticsChadChileChinaColombiaComorosCongo, Dem. Rep.Congo, Rep.Costa RicaCote d'IvoireCroatiaCubaCyprusCzech RepublicDenmarkDjiboutiDominicaDominican RepublicEarly-demographic dividendEast Asia & PacificEast Asia & Pacific (excluding high income)East Asia & Pacific (IDA & IBRD countries)EcuadorEgypt, Arab Rep.El SalvadorEquatorial GuineaEstoniaEthiopiaEuro areaEurope & Central AsiaEurope & Central Asia (excluding high income)Europe & Central Asia (IDA & IBRD countries)European UnionFaroe IslandsFijiFinlandFragile and conflict affected situationsFranceFrench PolynesiaGabonGambia, TheGeorgiaGermanyGhanaGibraltarGreeceGreenlandGrenadaGuamGuatemalaGuineaGuinea-BissauGuyanaHaitiHeavily indebted poor countries (HIPC)High incomeHondurasHong Kong SAR, ChinaHungaryIBRD onlyIcelandIDA & IBRD totalIDA blendIDA onlyIDA totalIndiaIndonesiaIran, Islamic Rep.IraqIrelandIsraelItalyJamaicaJapanJordanKazakhstanKenyaKiribatiKorea, Dem. People’s Rep.Korea, Rep.KosovoKuwaitKyrgyz RepublicLao PDRLate-demographic dividendLatin America & Caribbean Latin America & Caribbean (excluding high income)Latin America & the Caribbean (IDA & IBRD countries)LatviaLeast developed countries: UN classificationLebanonLiberiaLibyaLithuaniaLow & middle incomeLow incomeLower middle incomeLuxembourgMacao SAR, ChinaMacedonia, FYRMadagascarMalawiMalaysiaMaldivesMaliMaltaMauritaniaMauritiusMexicoMiddle East & North AfricaMiddle East & North Africa (excluding high income)Middle East & North Africa (IDA & IBRD countries)Middle incomeMoldovaMongoliaMontenegroMoroccoMozambiqueMyanmarNauruNepalNetherlandsNew CaledoniaNew ZealandNicaraguaNigerNigeriaNorth AmericaNorwayOECD membersOmanOther small statesPacific island small statesPakistanPanamaPapua New GuineaParaguayPeruPhilippinesPolandPortugalPost-demographic dividendPre-demographic dividendQatarRomaniaRussian FederationRwandaSamoaSao Tome and PrincipeSaudi ArabiaSenegalSerbiaSeychellesSierra LeoneSingaporeSlovak RepublicSloveniaSmall statesSolomon IslandsSomaliaSouth AfricaSouth AsiaSouth Asia (IDA & IBRD)SpainSri LankaSt. Kitts and NevisSt. LuciaSt. Vincent and the GrenadinesSub-Saharan Africa Sub-Saharan Africa (excluding high income)Sub-Saharan Africa (IDA & IBRD countries)SudanSurinameSwedenSwitzerlandSyrian Arab RepublicTajikistanTanzaniaThailandTogoTongaTrinidad and TobagoTunisiaTurkeyTurkmenistanTuvaluUgandaUkraineUnited Arab EmiratesUnited KingdomUnited StatesUpper middle incomeUruguayUzbekistanVanuatuVenezuela, RBVietnamWorldYemen, Rep.ZambiaZimbabwe línea de tiempo (timeline):
En esta escala de tiempo se presenta un gráfico de 1961 y 2015 de Other small states. Los datos de 1960 están ausentes. El número de observaciones reales por fecha: 55.
Fuente (nombre):
Indicadores del desarrollo mundial
Fuente (organización):
World Bank staff estimates based data from International Monetary Fund's Direction of Trade database.
Categorías:
Private Sector, Trade
Se ha actualizado:
23 abr 2017 año
Los indicadores de los cambios de valor en los últimos años
Mínimo:
219.4 millones
1 ene 1961 año
Máximo:
235.23 bn
1 ene 2014 año
A la fecha de observación
Valor
Cambio absoluto
El cambio con respecto al valor anterior
1 ene 1961 año
219.4 millones
+219.4 millones
0.0%
1 ene 1962 año
248.7 millones
+29.3 millones
13.35%
1 ene 1963 año
273.7 millones
+25.0 millones
10.05%
1 ene 1964 año
335.173 millones
+61.473 millones
22.46%
1 ene 1965 año
369.639 millones
+34.466 millones
10.28%
1 ene 1966 año
406.911 millones
+37.272 millones
10.08%
1 ene 1967 año
437.987 millones
+31.076 millones
7.64%
1 ene 1968 año
421.225 millones
-16.762 millones
-3.83%
1 ene 1969 año
508.137 millones
+86.912 millones
20.63%
1 ene 1970 año
571.132 millones
+62.995 millones
12.4%
1 ene 1971 año
518.223 millones
-52.909 millones
-9.26%
1 ene 1972 año
690.579 millones
+172.356 millones
33.26%
1 ene 1973 año
1.296 bn
+605.46 millones
87.67%
1 ene 1974 año
1.994 bn
+697.945 millones
53.85%
1 ene 1975 año
4.043 bn
+2.049 bn
102.76%
1 ene 1976 año
4.186 bn
+143.375 millones
3.55%
1 ene 1977 año
7.405 bn
+3.218 bn
76.88%
1 ene 1978 año
6.359 bn
-1.046 bn
-14.13%
1 ene 1979 año
6.988 bn
+629.782 millones
9.9%
1 ene 1980 año
12.692 bn
+5.704 bn
81.62%
1 ene 1981 año
18.091 bn
+5.399 bn
42.54%
1 ene 1982 año
17.793 bn
-298.023 millones
-1.65%
1 ene 1983 año
17.593 bn
-199.544 millones
-1.12%
1 ene 1984 año
14.988 bn
-2.605 bn
-14.81%
1 ene 1985 año
14.837 bn
-151.008 millones
-1.01%
1 ene 1986 año
13.541 bn
-1.296 bn
-8.73%
1 ene 1987 año
10.355 bn
-3.186 bn
-23.53%
1 ene 1988 año
11.193 bn
+837.666 millones
8.09%
1 ene 1989 año
11.587 bn
+394.475 millones
3.52%
1 ene 1990 año
13.131 bn
+1.544 bn
13.32%
1 ene 1991 año
17.093 bn
+3.962 bn
30.17%
1 ene 1992 año
15.565 bn
-1.528 bn
-8.94%
1 ene 1993 año
17.894 bn
+2.329 bn
14.96%
1 ene 1994 año
17.557 bn
-336.807 millones
-1.88%
1 ene 1995 año
19.49 bn
+1.933 bn
11.01%
1 ene 1996 año
22.667 bn
+3.177 bn
16.3%
1 ene 1997 año
25.338 bn
+2.671 bn
11.79%
1 ene 1998 año
29.149 bn
+3.811 bn
15.04%
1 ene 1999 año
26.475 bn
-2.674 bn
-9.17%
1 ene 2000 año
29.292 bn
+2.817 bn
10.64%
1 ene 2001 año
38.478 bn
+9.187 bn
31.36%
1 ene 2002 año
38.807 bn
+328.886 millones
0.85%
1 ene 2003 año
39.688 bn
+880.4 millones
2.27%
1 ene 2004 año
48.296 bn
+8.608 bn
21.69%
1 ene 2005 año
60.459 bn
+12.163 bn
25.19%
1 ene 2006 año
76.162 bn
+15.702 bn
25.97%
1 ene 2007 año
93.951 bn
+17.789 bn
23.36%
1 ene 2008 año
114.783 bn
+20.832 bn
22.17%
1 ene 2009 año
155.882 bn
+41.1 bn
35.81%
1 ene 2010 año
110.596 bn
-45.286 bn
-29.05%
1 ene 2011 año
151.082 bn
+40.486 bn
36.61%
1 ene 2012 año
211.407 bn
+60.325 bn
39.93%
1 ene 2013 año
234.093 bn
+22.685 bn
10.73%
1 ene 2014 año
235.23 bn
+1.137 bn
0.49%
1 ene 2015 año
227.383 bn
-7.846 bn
-3.34%
Ranking de los países por los datos estadísticos actuales


Comentarios: