29
/es/
es
AIzaSyAYiBZKx7MnpbEhh9jyipgxe19OcubqV5w
April 1, 2024
161718
Italy
ITA
true
2
1
Merchandise exports by the reporting economy (current US$)
2015,2014,2013,2012,2011,2010,2009,2008,2007,2006,2005,2004,2003,2002,2001,2000,1999,1998,1997,1996,1995,1994,1993,1992,1991,1990,1989,1988,1987,1986,1985,1984,1983,1982,1981,1980,1979,1978,1977,1976,1975,1974,1973,1972,1971,1970,1969,1968,1967,1966,1965,1964,1963,1962,1961
Estas estadísticas en otros países:
AfghanistanAlbaniaAlgeriaAmerican SamoaAngolaAntigua and BarbudaArab WorldArgentinaArmeniaArubaAustraliaAustriaAzerbaijanBahamas, TheBahrainBangladeshBarbadosBelarusBelgiumBelizeBeninBermudaBoliviaBosnia and HerzegovinaBrazilBrunei DarussalamBulgariaBurkina FasoBurundiCabo VerdeCambodiaCameroonCanadaCaribbean small statesCentral African RepublicCentral Europe and the BalticsChadChileChinaColombiaComorosCongo, Dem. Rep.Congo, Rep.Costa RicaCote d'IvoireCroatiaCubaCyprusCzech RepublicDenmarkDjiboutiDominicaDominican RepublicEarly-demographic dividendEast Asia & PacificEast Asia & Pacific (excluding high income)East Asia & Pacific (IDA & IBRD countries)EcuadorEgypt, Arab Rep.El SalvadorEquatorial GuineaEstoniaEthiopiaEuro areaEurope & Central AsiaEurope & Central Asia (excluding high income)Europe & Central Asia (IDA & IBRD countries)European UnionFaroe IslandsFijiFinlandFragile and conflict affected situationsFranceFrench PolynesiaGabonGambia, TheGeorgiaGermanyGhanaGibraltarGreeceGreenlandGrenadaGuamGuatemalaGuineaGuinea-BissauGuyanaHaitiHeavily indebted poor countries (HIPC)High incomeHondurasHong Kong SAR, ChinaHungaryIBRD onlyIcelandIDA & IBRD totalIDA blendIDA onlyIDA totalIndiaIndonesiaIran, Islamic Rep.IraqIrelandIsraelItalyJamaicaJapanJordanKazakhstanKenyaKiribatiKorea, Dem. People’s Rep.Korea, Rep.KosovoKuwaitKyrgyz RepublicLao PDRLate-demographic dividendLatin America & Caribbean Latin America & Caribbean (excluding high income)Latin America & the Caribbean (IDA & IBRD countries)LatviaLeast developed countries: UN classificationLebanonLiberiaLibyaLithuaniaLow & middle incomeLow incomeLower middle incomeLuxembourgMacao SAR, ChinaMacedonia, FYRMadagascarMalawiMalaysiaMaldivesMaliMaltaMauritaniaMauritiusMexicoMiddle East & North AfricaMiddle East & North Africa (excluding high income)Middle East & North Africa (IDA & IBRD countries)Middle incomeMoldovaMongoliaMontenegroMoroccoMozambiqueMyanmarNauruNepalNetherlandsNew CaledoniaNew ZealandNicaraguaNigerNigeriaNorth AmericaNorwayOECD membersOmanOther small statesPacific island small statesPakistanPanamaPapua New GuineaParaguayPeruPhilippinesPolandPortugalPost-demographic dividendPre-demographic dividendQatarRomaniaRussian FederationRwandaSamoaSao Tome and PrincipeSaudi ArabiaSenegalSerbiaSeychellesSierra LeoneSingaporeSlovak RepublicSloveniaSmall statesSolomon IslandsSomaliaSouth AfricaSouth AsiaSouth Asia (IDA & IBRD)SpainSri LankaSt. Kitts and NevisSt. LuciaSt. Vincent and the GrenadinesSub-Saharan Africa Sub-Saharan Africa (excluding high income)Sub-Saharan Africa (IDA & IBRD countries)SudanSurinameSwedenSwitzerlandSyrian Arab RepublicTajikistanTanzaniaThailandTogoTongaTrinidad and TobagoTunisiaTurkeyTurkmenistanTuvaluUgandaUkraineUnited Arab EmiratesUnited KingdomUnited StatesUpper middle incomeUruguayUzbekistanVanuatuVenezuela, RBVietnamWorldYemen, Rep.ZambiaZimbabwe línea de tiempo (timeline):
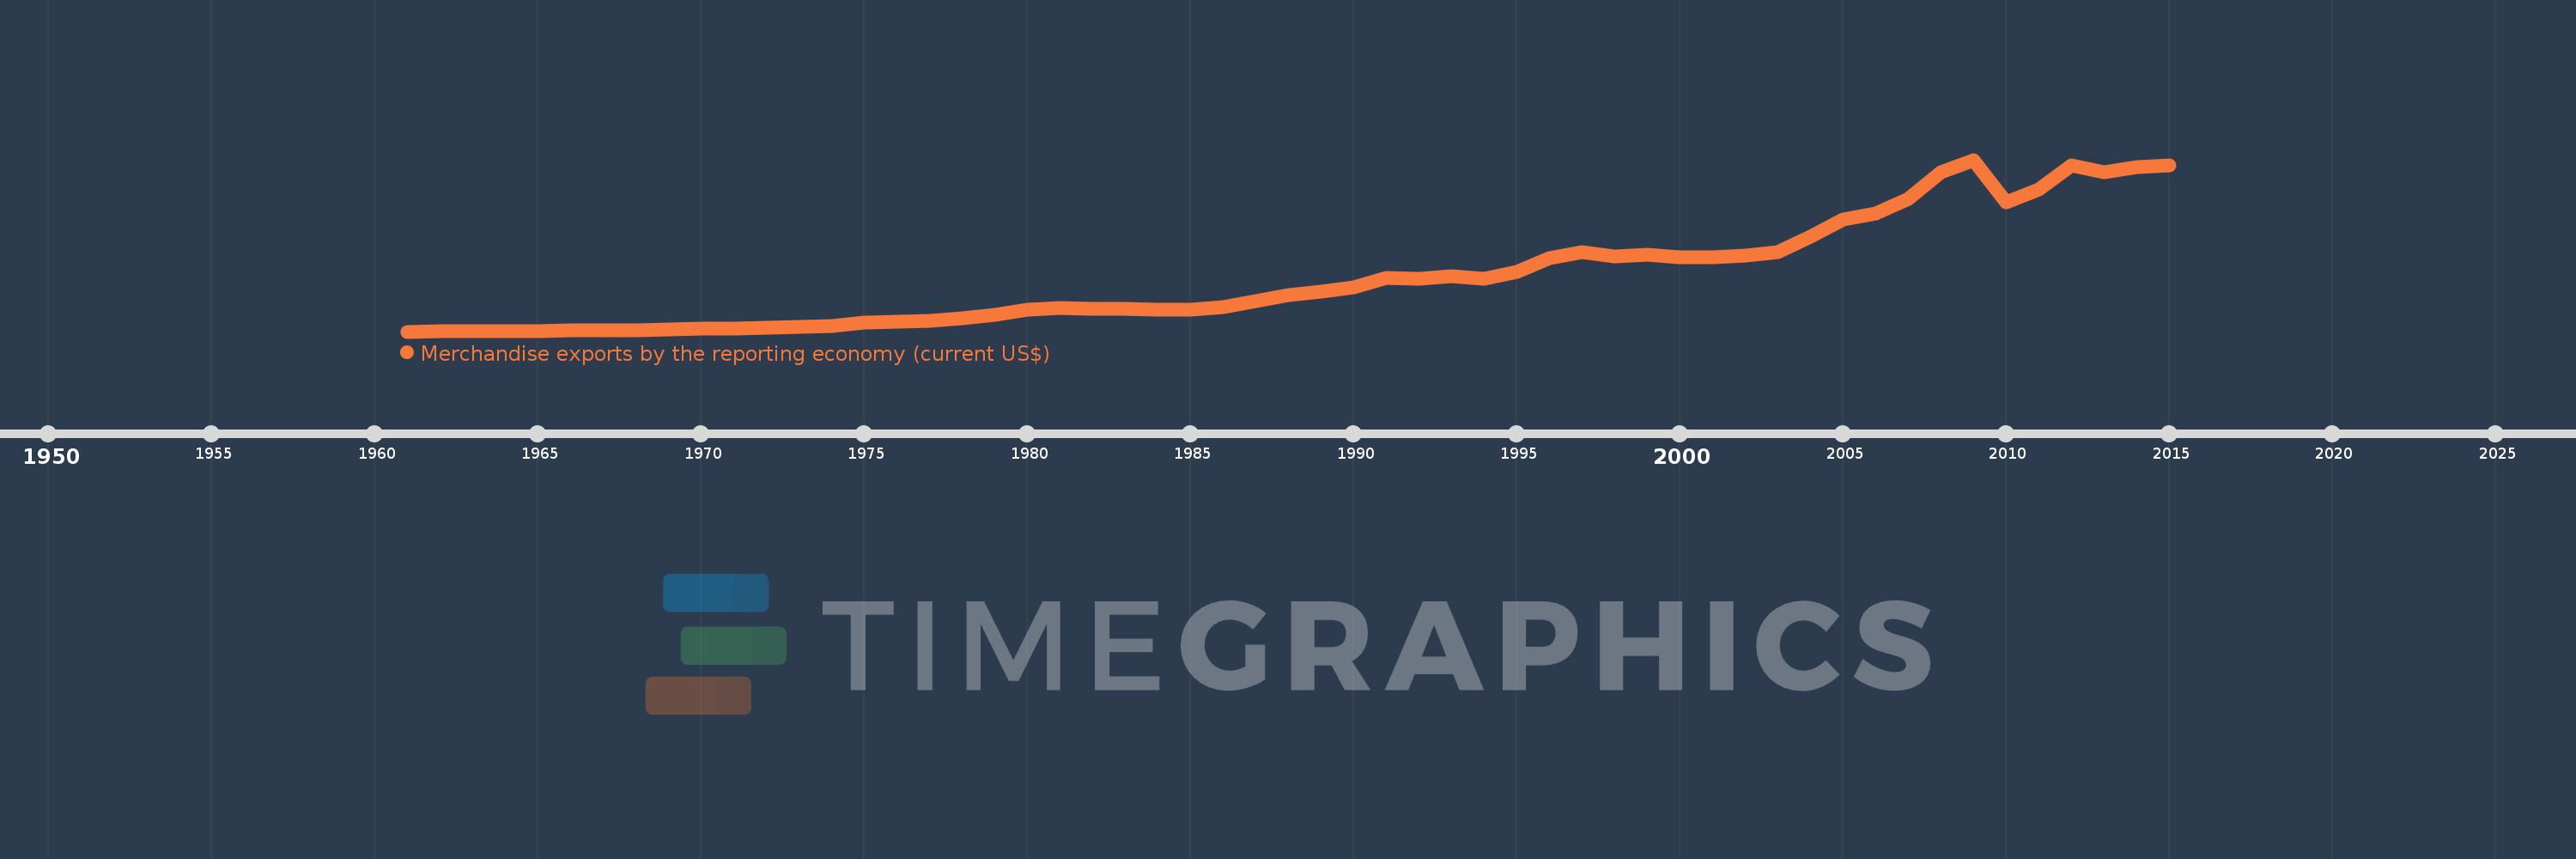
En esta escala de tiempo se presenta un gráfico de 1961 y 2015 de Italy. Los datos de 1960 están ausentes. El número de observaciones reales por fecha: 55.
Fuente (nombre):
Indicadores del desarrollo mundial
Fuente (organización):
World Bank staff estimates based data from International Monetary Fund's Direction of Trade database.
Categorías:
Private Sector, Trade
Se ha actualizado:
23 abr 2017 año
Los indicadores de los cambios de valor en los últimos años
Mínimo:
3.636 bn
1 ene 1961 año
Máximo:
539.671 bn
1 ene 2009 año
A la fecha de observación
Valor
Cambio absoluto
El cambio con respecto al valor anterior
1 ene 1961 año
3.636 bn
+3.636 bn
0.0%
1 ene 1962 año
4.178 bn
+542.3 millones
14.92%
1 ene 1963 año
4.66 bn
+481.8 millones
11.53%
1 ene 1964 año
5.038 bn
+378.4 millones
8.12%
1 ene 1965 año
5.907 bn
+869.1 millones
17.25%
1 ene 1966 año
7.154 bn
+1.247 bn
21.11%
1 ene 1967 año
8.026 bn
+872.0 millones
12.19%
1 ene 1968 año
8.691 bn
+664.9 millones
8.28%
1 ene 1969 año
10.154 bn
+1.463 bn
16.83%
1 ene 1970 año
11.737 bn
+1.583 bn
15.59%
1 ene 1971 año
13.18 bn
+1.442 bn
12.29%
1 ene 1972 año
15.056 bn
+1.877 bn
14.24%
1 ene 1973 año
18.539 bn
+3.482 bn
23.13%
1 ene 1974 año
22.207 bn
+3.668 bn
19.79%
1 ene 1975 año
30.465 bn
+8.258 bn
37.19%
1 ene 1976 año
34.819 bn
+4.354 bn
14.29%
1 ene 1977 año
37.242 bn
+2.423 bn
6.96%
1 ene 1978 año
45.303 bn
+8.06 bn
21.64%
1 ene 1979 año
56.048 bn
+10.745 bn
23.72%
1 ene 1980 año
72.199 bn
+16.152 bn
28.82%
1 ene 1981 año
77.642 bn
+5.443 bn
7.54%
1 ene 1982 año
75.263 bn
-2.379 bn
-3.06%
1 ene 1983 año
73.463 bn
-1.8 bn
-2.39%
1 ene 1984 año
72.703 bn
-760.4 millones
-1.04%
1 ene 1985 año
73.281 bn
+579.0 millones
0.8%
1 ene 1986 año
79.0 bn
+5.719 bn
7.8%
1 ene 1987 año
97.805 bn
+18.805 bn
23.8%
1 ene 1988 año
116.302 bn
+18.497 bn
18.91%
1 ene 1989 año
128.466 bn
+12.164 bn
10.46%
1 ene 1990 año
140.715 bn
+12.249 bn
9.54%
1 ene 1991 año
170.411 bn
+29.695 bn
21.1%
1 ene 1992 año
169.555 bn
-855.962 millones
-0.5%
1 ene 1993 año
177.428 bn
+7.873 bn
4.64%
1 ene 1994 año
168.277 bn
-9.151 bn
-5.16%
1 ene 1995 año
189.808 bn
+21.532 bn
12.8%
1 ene 1996 año
232.918 bn
+43.11 bn
22.71%
1 ene 1997 año
250.874 bn
+17.956 bn
7.71%
1 ene 1998 año
238.249 bn
-12.625 bn
-5.03%
1 ene 1999 año
242.678 bn
+4.429 bn
1.86%
1 ene 2000 año
235.082 bn
-7.595 bn
-3.13%
1 ene 2001 año
236.633 bn
+1.551 bn
0.66%
1 ene 2002 año
240.814 bn
+4.181 bn
1.77%
1 ene 2003 año
251.216 bn
+10.401 bn
4.32%
1 ene 2004 año
299.84 bn
+48.625 bn
19.36%
1 ene 2005 año
353.523 bn
+53.682 bn
17.9%
1 ene 2006 año
372.957 bn
+19.434 bn
5.5%
1 ene 2007 año
417.189 bn
+44.232 bn
11.86%
1 ene 2008 año
500.211 bn
+83.022 bn
19.9%
1 ene 2009 año
539.671 bn
+39.46 bn
7.89%
1 ene 2010 año
406.808 bn
-132.863 bn
-24.62%
1 ene 2011 año
446.796 bn
+39.988 bn
9.83%
1 ene 2012 año
523.202 bn
+76.406 bn
17.1%
1 ene 2013 año
501.316 bn
-21.887 bn
-4.18%
1 ene 2014 año
517.952 bn
+16.637 bn
3.32%
1 ene 2015 año
521.495 bn
+3.542 bn
0.68%
Ranking de los países por los datos estadísticos actuales


Comentarios: