29
/es/
es
AIzaSyAYiBZKx7MnpbEhh9jyipgxe19OcubqV5w
April 1, 2024
73716
Austria
AUT
true
2
1
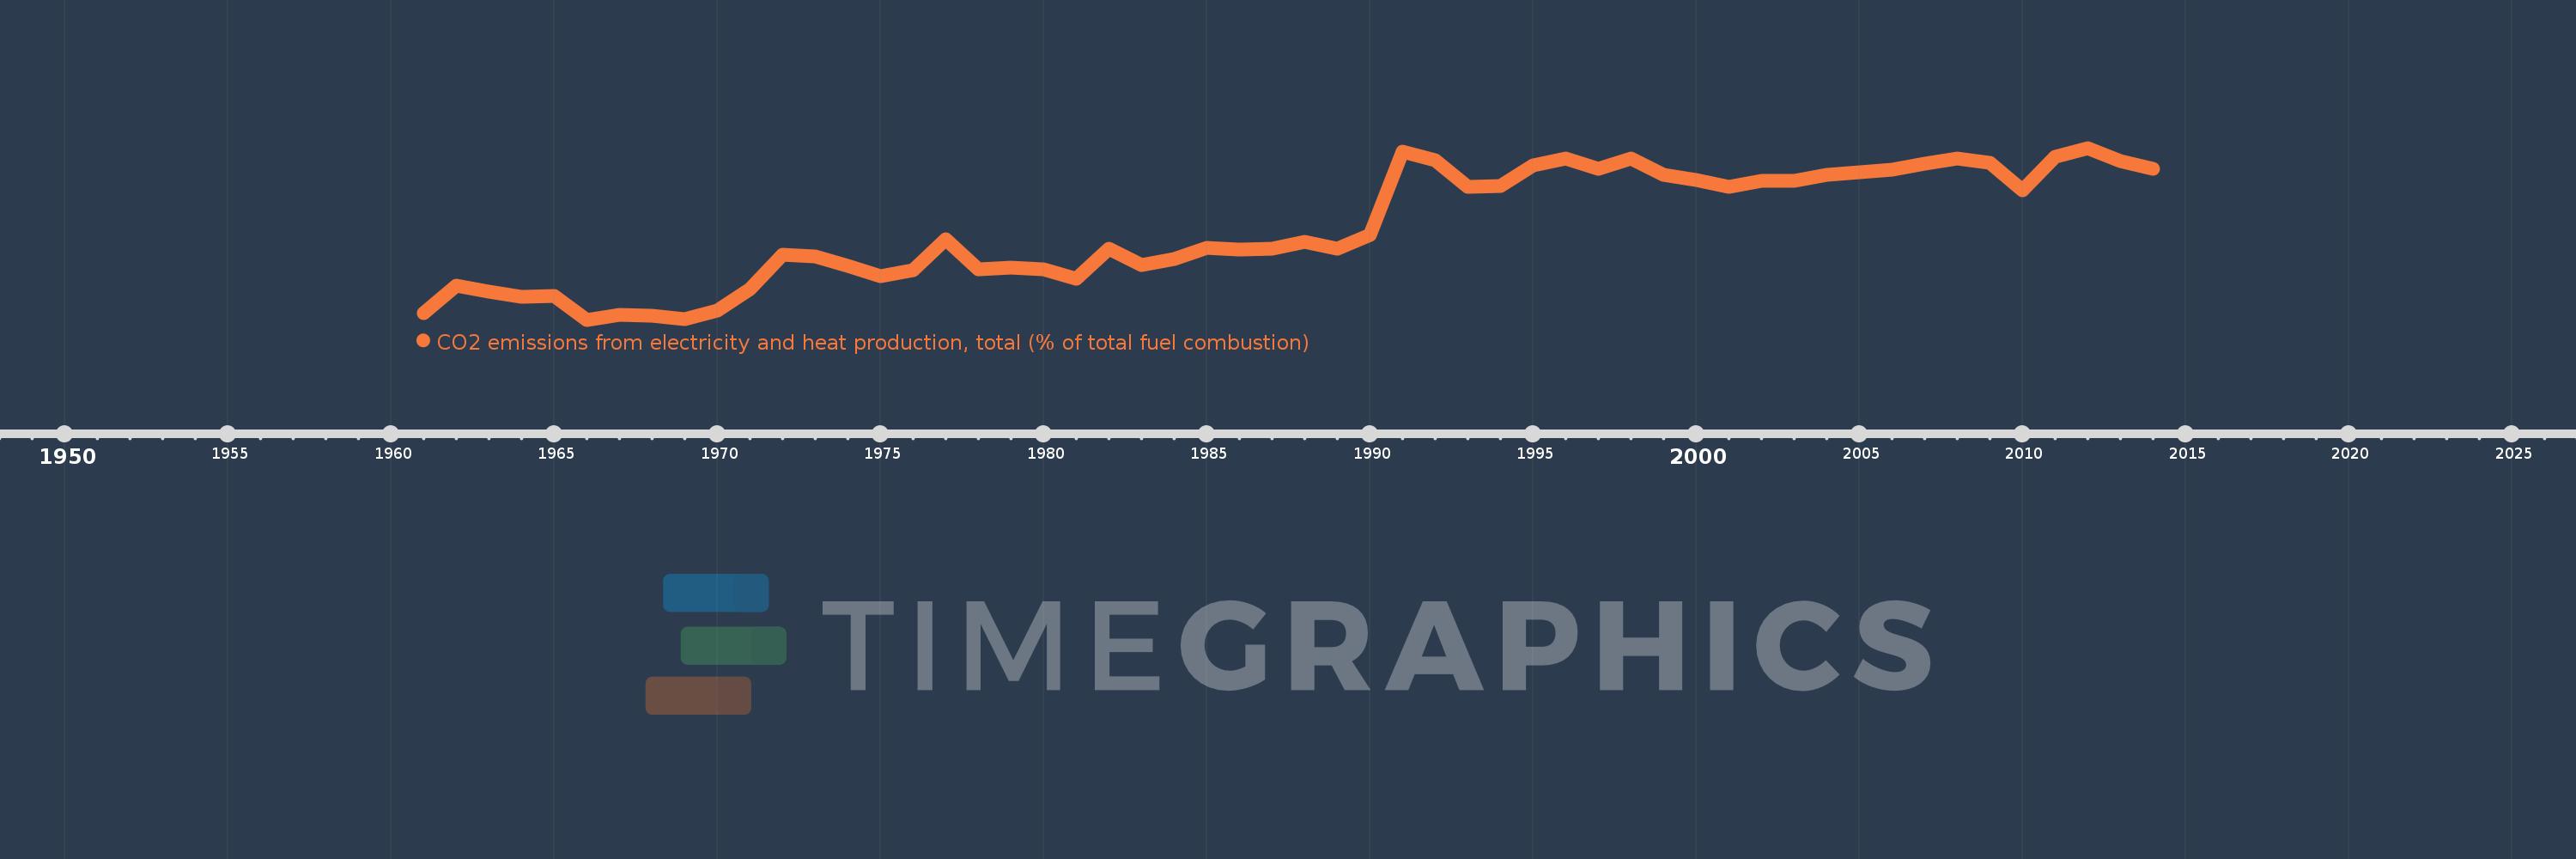
CO2 emissions from electricity and heat production, total (% of total fuel combustion)
2014,2013,2012,2011,2010,2009,2008,2007,2006,2005,2004,2003,2002,2001,2000,1999,1998,1997,1996,1995,1994,1993,1992,1991,1990,1989,1988,1987,1986,1985,1984,1983,1982,1981,1980,1979,1978,1977,1976,1975,1974,1973,1972,1971,1970,1969,1968,1967,1966,1965,1964,1963,1962,1961
Estas estadísticas en otros países:
AlbaniaAlgeriaAngolaArab WorldArgentinaArmeniaAustraliaAustriaAzerbaijanBahrainBangladeshBelarusBelgiumBeninBoliviaBosnia and HerzegovinaBotswanaBrazilBrunei DarussalamBulgariaCambodiaCameroonCanadaCaribbean small statesCentral Europe and the BalticsChileChinaColombiaCongo, Dem. Rep.Congo, Rep.Costa RicaCote d'IvoireCroatiaCubaCuracaoCyprusCzech RepublicDenmarkDominican RepublicEarly-demographic dividendEast Asia & PacificEast Asia & Pacific (excluding high income)East Asia & Pacific (IDA & IBRD countries)EcuadorEgypt, Arab Rep.El SalvadorEritreaEstoniaEthiopiaEuro areaEurope & Central AsiaEurope & Central Asia (excluding high income)Europe & Central Asia (IDA & IBRD countries)European UnionFinlandFragile and conflict affected situationsFranceGabonGeorgiaGermanyGhanaGibraltarGreeceGuatemalaHaitiHeavily indebted poor countries (HIPC)High incomeHondurasHong Kong SAR, ChinaHungaryIBRD onlyIcelandIDA & IBRD totalIDA blendIDA onlyIDA totalIndiaIndonesiaIran, Islamic Rep.IraqIrelandIsraelItalyJamaicaJapanJordanKazakhstanKenyaKorea, Dem. People’s Rep.Korea, Rep.KosovoKuwaitKyrgyz RepublicLate-demographic dividendLatin America & Caribbean Latin America & Caribbean (excluding high income)Latin America & the Caribbean (IDA & IBRD countries)LatviaLeast developed countries: UN classificationLebanonLibyaLithuaniaLow & middle incomeLow incomeLower middle incomeLuxembourgMacedonia, FYRMalaysiaMaltaMauritiusMexicoMiddle East & North AfricaMiddle East & North Africa (excluding high income)Middle East & North Africa (IDA & IBRD countries)Middle incomeMoldovaMongoliaMontenegroMoroccoMozambiqueMyanmarNamibiaNepalNetherlandsNew ZealandNicaraguaNigerNigeriaNorth AmericaNorwayOECD membersOmanOther small statesPakistanPanamaParaguayPeruPhilippinesPolandPortugalPost-demographic dividendPre-demographic dividendQatarRomaniaRussian FederationSaudi ArabiaSenegalSerbiaSingaporeSlovak RepublicSloveniaSmall statesSouth AfricaSouth AsiaSouth Asia (IDA & IBRD)South SudanSpainSri LankaSub-Saharan Africa Sub-Saharan Africa (excluding high income)Sub-Saharan Africa (IDA & IBRD countries)SudanSwedenSwitzerlandSyrian Arab RepublicTajikistanTanzaniaThailandTogoTrinidad and TobagoTunisiaTurkeyTurkmenistanUkraineUnited Arab EmiratesUnited KingdomUnited StatesUpper middle incomeUruguayUzbekistanVenezuela, RBVietnamWorldYemen, Rep.ZambiaZimbabwe línea de tiempo (timeline):
En esta escala de tiempo se presenta un gráfico de 1961 y 2014 de Austria. Los datos de 1960 están ausentes. El número de observaciones reales por fecha: 54.
Fuente (nombre):
Indicadores del desarrollo mundial
Fuente (organización):
IEA Statistics © OECD/IEA 2014 (http://www.iea.org/stats/index.asp), subject to https://www.iea.org/t&c/termsandconditions/
Categorías:
Environment
Se ha actualizado:
23 abr 2017 año
Los indicadores de los cambios de valor en los últimos años
Mínimo:
17.029
1 ene 1966 año
Máximo:
36.304
1 ene 2012 año
A la fecha de observación
Valor
Cambio absoluto
El cambio con respecto al valor anterior
1 ene 1961 año
17.724
+17.724
0.0%
1 ene 1962 año
20.848
+3.124
17.62%
1 ene 1963 año
20.186
-0.663
-3.18%
1 ene 1964 año
19.555
-0.63
-3.12%
1 ene 1965 año
19.666
+0.11
0.56%
1 ene 1966 año
17.029
-2.636
-13.41%
1 ene 1967 año
17.549
+0.519
3.05%
1 ene 1968 año
17.496
-0.053
-0.3%
1 ene 1969 año
17.074
-0.422
-2.41%
1 ene 1970 año
18.021
+0.947
5.54%
1 ene 1971 año
20.448
+2.427
13.47%
1 ene 1972 año
24.362
+3.914
19.14%
1 ene 1973 año
24.107
-0.255
-1.05%
1 ene 1974 año
23.104
-1.003
-4.16%
1 ene 1975 año
21.89
-1.214
-5.26%
1 ene 1976 año
22.575
+0.685
3.13%
1 ene 1977 año
26.029
+3.454
15.3%
1 ene 1978 año
22.642
-3.387
-13.01%
1 ene 1979 año
22.908
+0.265
1.17%
1 ene 1980 año
22.648
-0.26
-1.14%
1 ene 1981 año
21.605
-1.043
-4.6%
1 ene 1982 año
24.985
+3.381
15.65%
1 ene 1983 año
23.207
-1.779
-7.12%
1 ene 1984 año
23.831
+0.624
2.69%
1 ene 1985 año
25.118
+1.287
5.4%
1 ene 1986 año
24.905
-0.213
-0.85%
1 ene 1987 año
25.005
+0.1
0.4%
1 ene 1988 año
25.773
+0.768
3.07%
1 ene 1989 año
24.995
-0.778
-3.02%
1 ene 1990 año
26.578
+1.583
6.33%
1 ene 1991 año
35.933
+9.355
35.2%
1 ene 1992 año
34.908
-1.025
-2.85%
1 ene 1993 año
31.951
-2.957
-8.47%
1 ene 1994 año
31.998
+0.047
0.15%
1 ene 1995 año
34.308
+2.31
7.22%
1 ene 1996 año
35.123
+0.815
2.37%
1 ene 1997 año
33.999
-1.124
-3.2%
1 ene 1998 año
35.099
+1.1
3.24%
1 ene 1999 año
33.317
-1.781
-5.08%
1 ene 2000 año
32.73
-0.588
-1.76%
1 ene 2001 año
31.923
-0.807
-2.47%
1 ene 2002 año
32.617
+0.694
2.17%
1 ene 2003 año
32.659
+0.042
0.13%
1 ene 2004 año
33.292
+0.633
1.94%
1 ene 2005 año
33.59
+0.298
0.89%
1 ene 2006 año
33.866
+0.276
0.82%
1 ene 2007 año
34.528
+0.662
1.95%
1 ene 2008 año
35.084
+0.556
1.61%
1 ene 2009 año
34.625
-0.459
-1.31%
1 ene 2010 año
31.565
-3.059
-8.84%
1 ene 2011 año
35.327
+3.762
11.92%
1 ene 2012 año
36.304
+0.977
2.76%
1 ene 2013 año
34.867
-1.436
-3.96%
1 ene 2014 año
33.994
-0.874
-2.51%
Ranking de los países por los datos estadísticos actuales


Comentarios: