29
/es/
es
AIzaSyAYiBZKx7MnpbEhh9jyipgxe19OcubqV5w
April 1, 2024
111989
Costa Rica
CRI
true
2
1
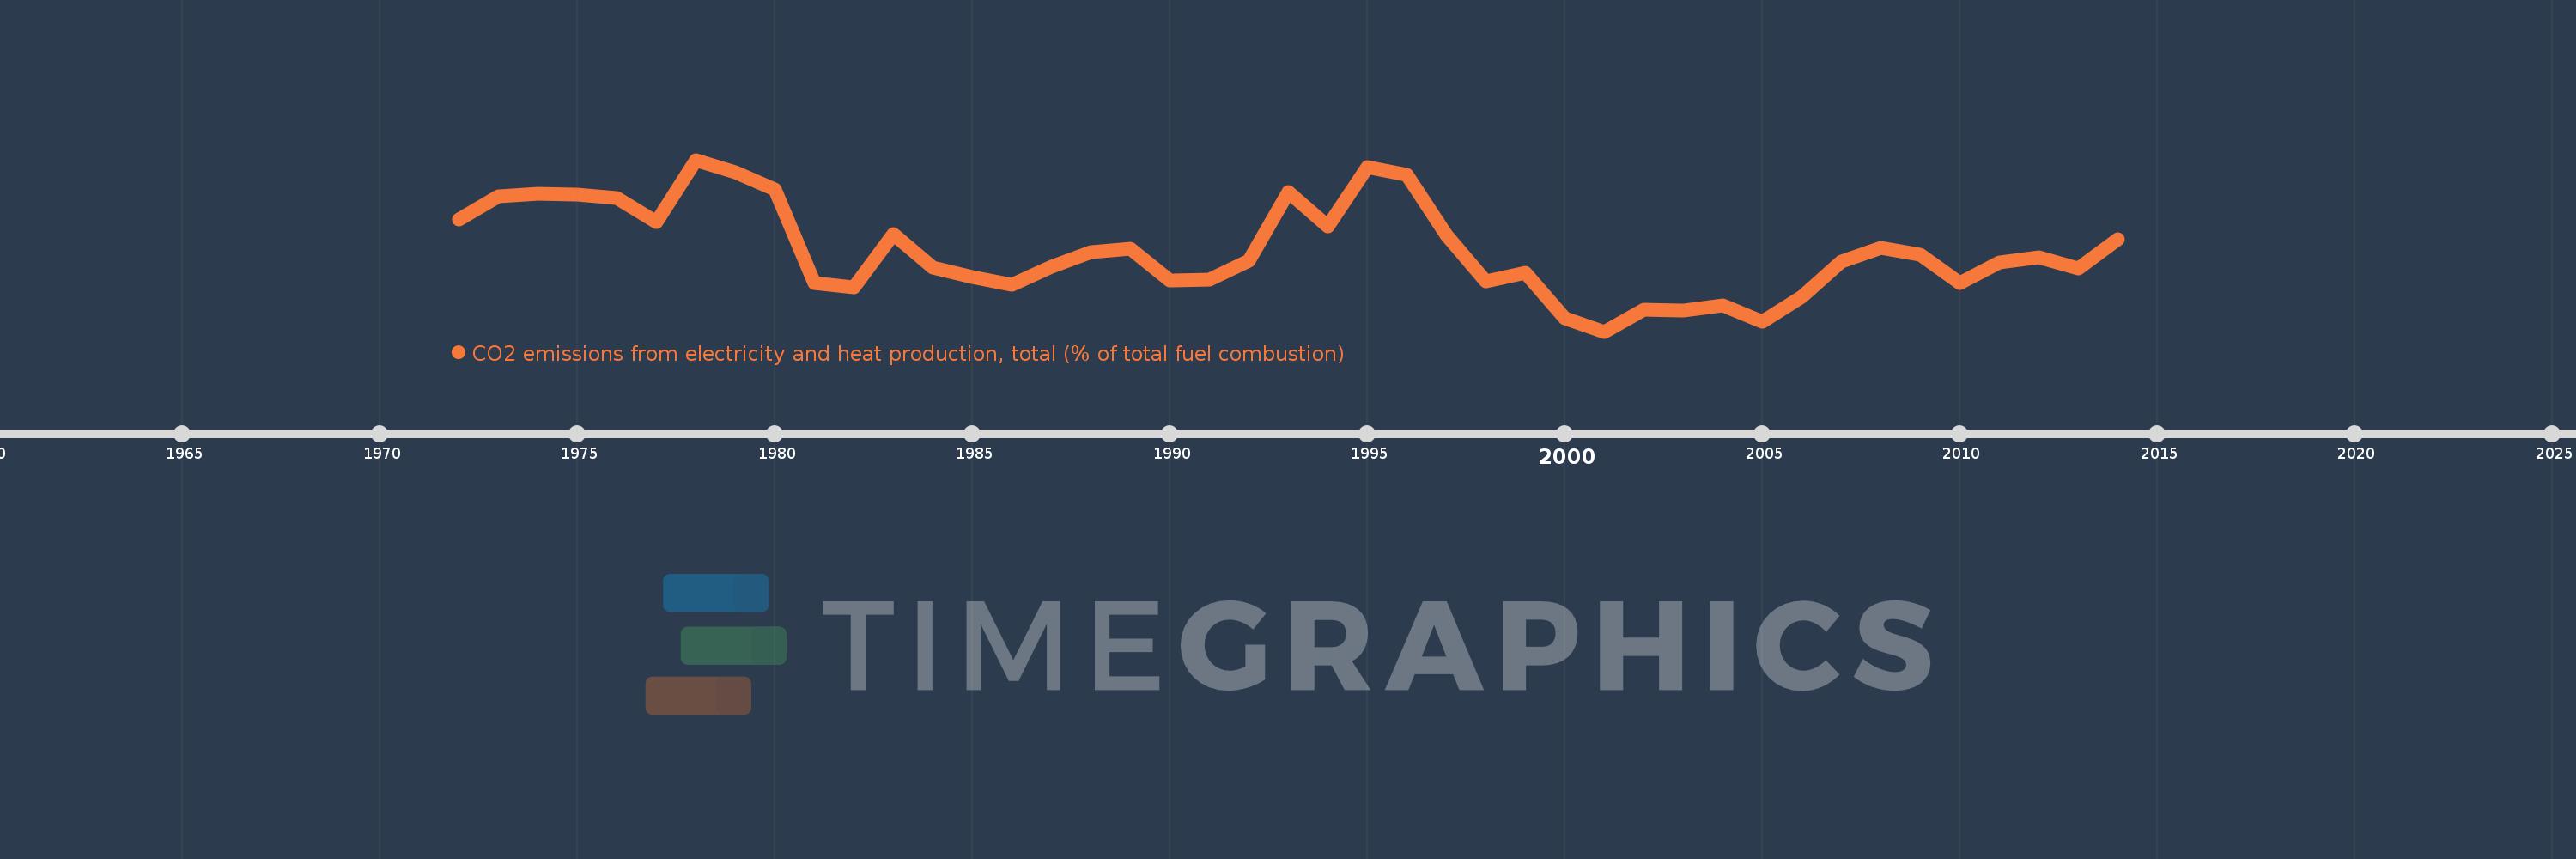
CO2 emissions from electricity and heat production, total (% of total fuel combustion)
2014,2013,2012,2011,2010,2009,2008,2007,2006,2005,2004,2003,2002,2001,2000,1999,1998,1997,1996,1995,1994,1993,1992,1991,1990,1989,1988,1987,1986,1985,1984,1983,1982,1981,1980,1979,1978,1977,1976,1975,1974,1973,1972
Estas estadísticas en otros países:
AlbaniaAlgeriaAngolaArab WorldArgentinaArmeniaAustraliaAustriaAzerbaijanBahrainBangladeshBelarusBelgiumBeninBoliviaBosnia and HerzegovinaBotswanaBrazilBrunei DarussalamBulgariaCambodiaCameroonCanadaCaribbean small statesCentral Europe and the BalticsChileChinaColombiaCongo, Dem. Rep.Congo, Rep.Costa RicaCote d'IvoireCroatiaCubaCuracaoCyprusCzech RepublicDenmarkDominican RepublicEarly-demographic dividendEast Asia & PacificEast Asia & Pacific (excluding high income)East Asia & Pacific (IDA & IBRD countries)EcuadorEgypt, Arab Rep.El SalvadorEritreaEstoniaEthiopiaEuro areaEurope & Central AsiaEurope & Central Asia (excluding high income)Europe & Central Asia (IDA & IBRD countries)European UnionFinlandFragile and conflict affected situationsFranceGabonGeorgiaGermanyGhanaGibraltarGreeceGuatemalaHaitiHeavily indebted poor countries (HIPC)High incomeHondurasHong Kong SAR, ChinaHungaryIBRD onlyIcelandIDA & IBRD totalIDA blendIDA onlyIDA totalIndiaIndonesiaIran, Islamic Rep.IraqIrelandIsraelItalyJamaicaJapanJordanKazakhstanKenyaKorea, Dem. People’s Rep.Korea, Rep.KosovoKuwaitKyrgyz RepublicLate-demographic dividendLatin America & Caribbean Latin America & Caribbean (excluding high income)Latin America & the Caribbean (IDA & IBRD countries)LatviaLeast developed countries: UN classificationLebanonLibyaLithuaniaLow & middle incomeLow incomeLower middle incomeLuxembourgMacedonia, FYRMalaysiaMaltaMauritiusMexicoMiddle East & North AfricaMiddle East & North Africa (excluding high income)Middle East & North Africa (IDA & IBRD countries)Middle incomeMoldovaMongoliaMontenegroMoroccoMozambiqueMyanmarNamibiaNepalNetherlandsNew ZealandNicaraguaNigerNigeriaNorth AmericaNorwayOECD membersOmanOther small statesPakistanPanamaParaguayPeruPhilippinesPolandPortugalPost-demographic dividendPre-demographic dividendQatarRomaniaRussian FederationSaudi ArabiaSenegalSerbiaSingaporeSlovak RepublicSloveniaSmall statesSouth AfricaSouth AsiaSouth Asia (IDA & IBRD)South SudanSpainSri LankaSub-Saharan Africa Sub-Saharan Africa (excluding high income)Sub-Saharan Africa (IDA & IBRD countries)SudanSwedenSwitzerlandSyrian Arab RepublicTajikistanTanzaniaThailandTogoTrinidad and TobagoTunisiaTurkeyTurkmenistanUkraineUnited Arab EmiratesUnited KingdomUnited StatesUpper middle incomeUruguayUzbekistanVenezuela, RBVietnamWorldYemen, Rep.ZambiaZimbabwe línea de tiempo (timeline):
En esta escala de tiempo se presenta un gráfico de 1972 y 2014 de Costa Rica. Los datos de 1971 están ausentes. El número de observaciones reales por fecha: 43.
Fuente (nombre):
Indicadores del desarrollo mundial
Fuente (organización):
IEA Statistics © OECD/IEA 2014 (http://www.iea.org/stats/index.asp), subject to https://www.iea.org/t&c/termsandconditions/
Categorías:
Environment
Se ha actualizado:
23 abr 2017 año
Los indicadores de los cambios de valor en los últimos años
Mínimo:
1.333
1 ene 2001 año
Máximo:
21.053
1 ene 1978 año
A la fecha de observación
Valor
Cambio absoluto
El cambio con respecto al valor anterior
1 ene 1972 año
14.173
+14.173
0.0%
1 ene 1973 año
16.901
+2.728
19.25%
1 ene 1974 año
17.178
+0.277
1.64%
1 ene 1975 año
17.089
-0.089
-0.52%
1 ene 1976 año
16.667
-0.422
-2.47%
1 ene 1977 año
13.889
-2.778
-16.67%
1 ene 1978 año
21.053
+7.164
51.58%
1 ene 1979 año
19.672
-1.381
-6.56%
1 ene 1980 año
17.695
-1.977
-10.05%
1 ene 1981 año
6.944
-10.751
-60.76%
1 ene 1982 año
6.436
-0.509
-7.33%
1 ene 1983 año
12.5
+6.064
94.23%
1 ene 1984 año
8.671
-3.829
-30.64%
1 ene 1985 año
7.609
-1.062
-12.25%
1 ene 1986 año
6.667
-0.942
-12.38%
1 ene 1987 año
8.738
+2.071
31.07%
1 ene 1988 año
10.455
+1.717
19.65%
1 ene 1989 año
10.823
+0.368
3.52%
1 ene 1990 año
7.224
-3.598
-33.25%
1 ene 1991 año
7.308
+0.083
1.15%
1 ene 1992 año
9.42
+2.113
28.91%
1 ene 1993 año
17.358
+7.937
84.26%
1 ene 1994 año
13.386
-3.972
-22.88%
1 ene 1995 año
20.225
+6.839
51.09%
1 ene 1996 año
19.369
-0.855
-4.23%
1 ene 1997 año
12.47
-6.899
-35.62%
1 ene 1998 año
7.09
-5.38
-43.14%
1 ene 1999 año
8.132
+1.041
14.69%
1 ene 2000 año
2.851
-5.281
-64.94%
1 ene 2001 año
1.333
-1.518
-53.23%
1 ene 2002 año
3.87
+2.536
190.22%
1 ene 2003 año
3.785
-0.085
-2.19%
1 ene 2004 año
4.323
+0.538
14.23%
1 ene 2005 año
2.448
-1.875
-43.37%
1 ene 2006 año
5.331
+2.883
117.75%
1 ene 2007 año
9.38
+4.049
75.96%
1 ene 2008 año
10.945
+1.564
16.68%
1 ene 2009 año
10.18
-0.765
-6.99%
1 ene 2010 año
6.918
-3.261
-32.04%
1 ene 2011 año
9.228
+2.31
33.39%
1 ene 2012 año
9.911
+0.683
7.4%
1 ene 2013 año
8.626
-1.286
-12.97%
1 ene 2014 año
11.921
+3.296
38.21%
Ranking de los países por los datos estadísticos actuales


Comentarios: