29
/es/
es
AIzaSyAYiBZKx7MnpbEhh9jyipgxe19OcubqV5w
April 1, 2024
115636
Cuba
CUB
true
2
1
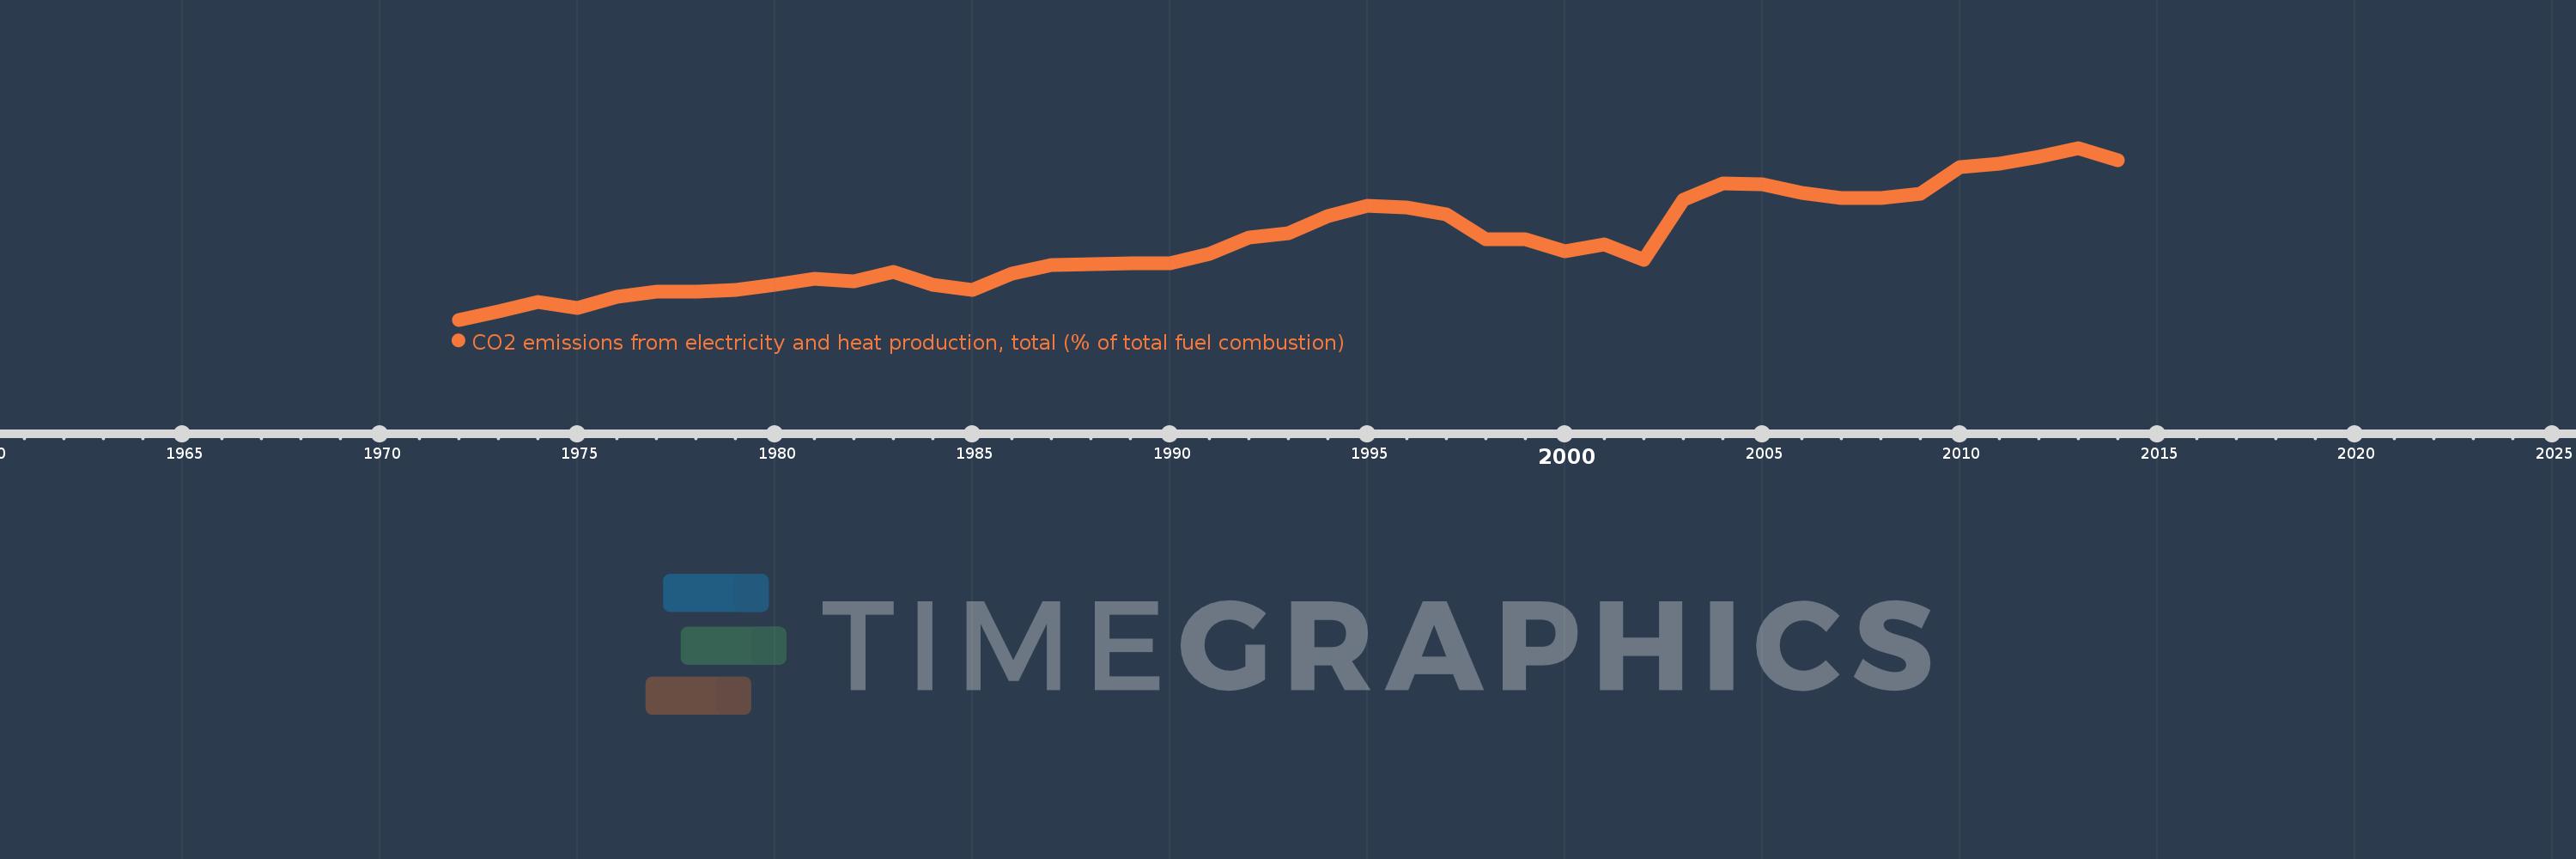
CO2 emissions from electricity and heat production, total (% of total fuel combustion)
2014,2013,2012,2011,2010,2009,2008,2007,2006,2005,2004,2003,2002,2001,2000,1999,1998,1997,1996,1995,1994,1993,1992,1991,1990,1989,1988,1987,1986,1985,1984,1983,1982,1981,1980,1979,1978,1977,1976,1975,1974,1973,1972
Estas estadísticas en otros países:
AlbaniaAlgeriaAngolaArab WorldArgentinaArmeniaAustraliaAustriaAzerbaijanBahrainBangladeshBelarusBelgiumBeninBoliviaBosnia and HerzegovinaBotswanaBrazilBrunei DarussalamBulgariaCambodiaCameroonCanadaCaribbean small statesCentral Europe and the BalticsChileChinaColombiaCongo, Dem. Rep.Congo, Rep.Costa RicaCote d'IvoireCroatiaCubaCuracaoCyprusCzech RepublicDenmarkDominican RepublicEarly-demographic dividendEast Asia & PacificEast Asia & Pacific (excluding high income)East Asia & Pacific (IDA & IBRD countries)EcuadorEgypt, Arab Rep.El SalvadorEritreaEstoniaEthiopiaEuro areaEurope & Central AsiaEurope & Central Asia (excluding high income)Europe & Central Asia (IDA & IBRD countries)European UnionFinlandFragile and conflict affected situationsFranceGabonGeorgiaGermanyGhanaGibraltarGreeceGuatemalaHaitiHeavily indebted poor countries (HIPC)High incomeHondurasHong Kong SAR, ChinaHungaryIBRD onlyIcelandIDA & IBRD totalIDA blendIDA onlyIDA totalIndiaIndonesiaIran, Islamic Rep.IraqIrelandIsraelItalyJamaicaJapanJordanKazakhstanKenyaKorea, Dem. People’s Rep.Korea, Rep.KosovoKuwaitKyrgyz RepublicLate-demographic dividendLatin America & Caribbean Latin America & Caribbean (excluding high income)Latin America & the Caribbean (IDA & IBRD countries)LatviaLeast developed countries: UN classificationLebanonLibyaLithuaniaLow & middle incomeLow incomeLower middle incomeLuxembourgMacedonia, FYRMalaysiaMaltaMauritiusMexicoMiddle East & North AfricaMiddle East & North Africa (excluding high income)Middle East & North Africa (IDA & IBRD countries)Middle incomeMoldovaMongoliaMontenegroMoroccoMozambiqueMyanmarNamibiaNepalNetherlandsNew ZealandNicaraguaNigerNigeriaNorth AmericaNorwayOECD membersOmanOther small statesPakistanPanamaParaguayPeruPhilippinesPolandPortugalPost-demographic dividendPre-demographic dividendQatarRomaniaRussian FederationSaudi ArabiaSenegalSerbiaSingaporeSlovak RepublicSloveniaSmall statesSouth AfricaSouth AsiaSouth Asia (IDA & IBRD)South SudanSpainSri LankaSub-Saharan Africa Sub-Saharan Africa (excluding high income)Sub-Saharan Africa (IDA & IBRD countries)SudanSwedenSwitzerlandSyrian Arab RepublicTajikistanTanzaniaThailandTogoTrinidad and TobagoTunisiaTurkeyTurkmenistanUkraineUnited Arab EmiratesUnited KingdomUnited StatesUpper middle incomeUruguayUzbekistanVenezuela, RBVietnamWorldYemen, Rep.ZambiaZimbabwe línea de tiempo (timeline):
En esta escala de tiempo se presenta un gráfico de 1972 y 2014 de Cuba. Los datos de 1971 están ausentes. El número de observaciones reales por fecha: 43.
Fuente (nombre):
Indicadores del desarrollo mundial
Fuente (organización):
IEA Statistics © OECD/IEA 2014 (http://www.iea.org/stats/index.asp), subject to https://www.iea.org/t&c/termsandconditions/
Categorías:
Environment
Se ha actualizado:
23 abr 2017 año
Los indicadores de los cambios de valor en los últimos años
Mínimo:
21.768
1 ene 1972 año
Máximo:
63.522
1 ene 2013 año
A la fecha de observación
Valor
Cambio absoluto
El cambio con respecto al valor anterior
1 ene 1972 año
21.768
+21.768
0.0%
1 ene 1973 año
23.826
+2.058
9.45%
1 ene 1974 año
26.129
+2.303
9.67%
1 ene 1975 año
24.586
-1.543
-5.91%
1 ene 1976 año
27.254
+2.668
10.85%
1 ene 1977 año
28.611
+1.357
4.98%
1 ene 1978 año
28.66
+0.049
0.17%
1 ene 1979 año
29.091
+0.431
1.5%
1 ene 1980 año
30.256
+1.165
4.01%
1 ene 1981 año
31.726
+1.47
4.86%
1 ene 1982 año
31.116
-0.609
-1.92%
1 ene 1983 año
33.366
+2.25
7.23%
1 ene 1984 año
30.31
-3.056
-9.16%
1 ene 1985 año
29.108
-1.203
-3.97%
1 ene 1986 año
32.888
+3.78
12.99%
1 ene 1987 año
34.992
+2.105
6.4%
1 ene 1988 año
35.212
+0.22
0.63%
1 ene 1989 año
35.497
+0.285
0.81%
1 ene 1990 año
35.48
-0.018
-0.05%
1 ene 1991 año
37.683
+2.204
6.21%
1 ene 1992 año
41.657
+3.974
10.55%
1 ene 1993 año
42.77
+1.112
2.67%
1 ene 1994 año
46.969
+4.199
9.82%
1 ene 1995 año
49.457
+2.488
5.3%
1 ene 1996 año
48.996
-0.461
-0.93%
1 ene 1997 año
47.377
-1.619
-3.3%
1 ene 1998 año
41.341
-6.036
-12.74%
1 ene 1999 año
41.382
+0.041
0.1%
1 ene 2000 año
38.416
-2.966
-7.17%
1 ene 2001 año
39.978
+1.562
4.07%
1 ene 2002 año
36.391
-3.587
-8.97%
1 ene 2003 año
50.89
+14.499
39.84%
1 ene 2004 año
54.831
+3.94
7.74%
1 ene 2005 año
54.722
-0.109
-0.2%
1 ene 2006 año
52.632
-2.09
-3.82%
1 ene 2007 año
51.415
-1.216
-2.31%
1 ene 2008 año
51.405
-0.01
-0.02%
1 ene 2009 año
52.343
+0.939
1.83%
1 ene 2010 año
58.811
+6.467
12.36%
1 ene 2011 año
59.598
+0.787
1.34%
1 ene 2012 año
61.346
+1.748
2.93%
1 ene 2013 año
63.522
+2.176
3.55%
1 ene 2014 año
60.524
-2.998
-4.72%
Ranking de los países por los datos estadísticos actuales


Comentarios: