29
/es/
es
AIzaSyAYiBZKx7MnpbEhh9jyipgxe19OcubqV5w
April 1, 2024
105757
China
CHN
true
2
1
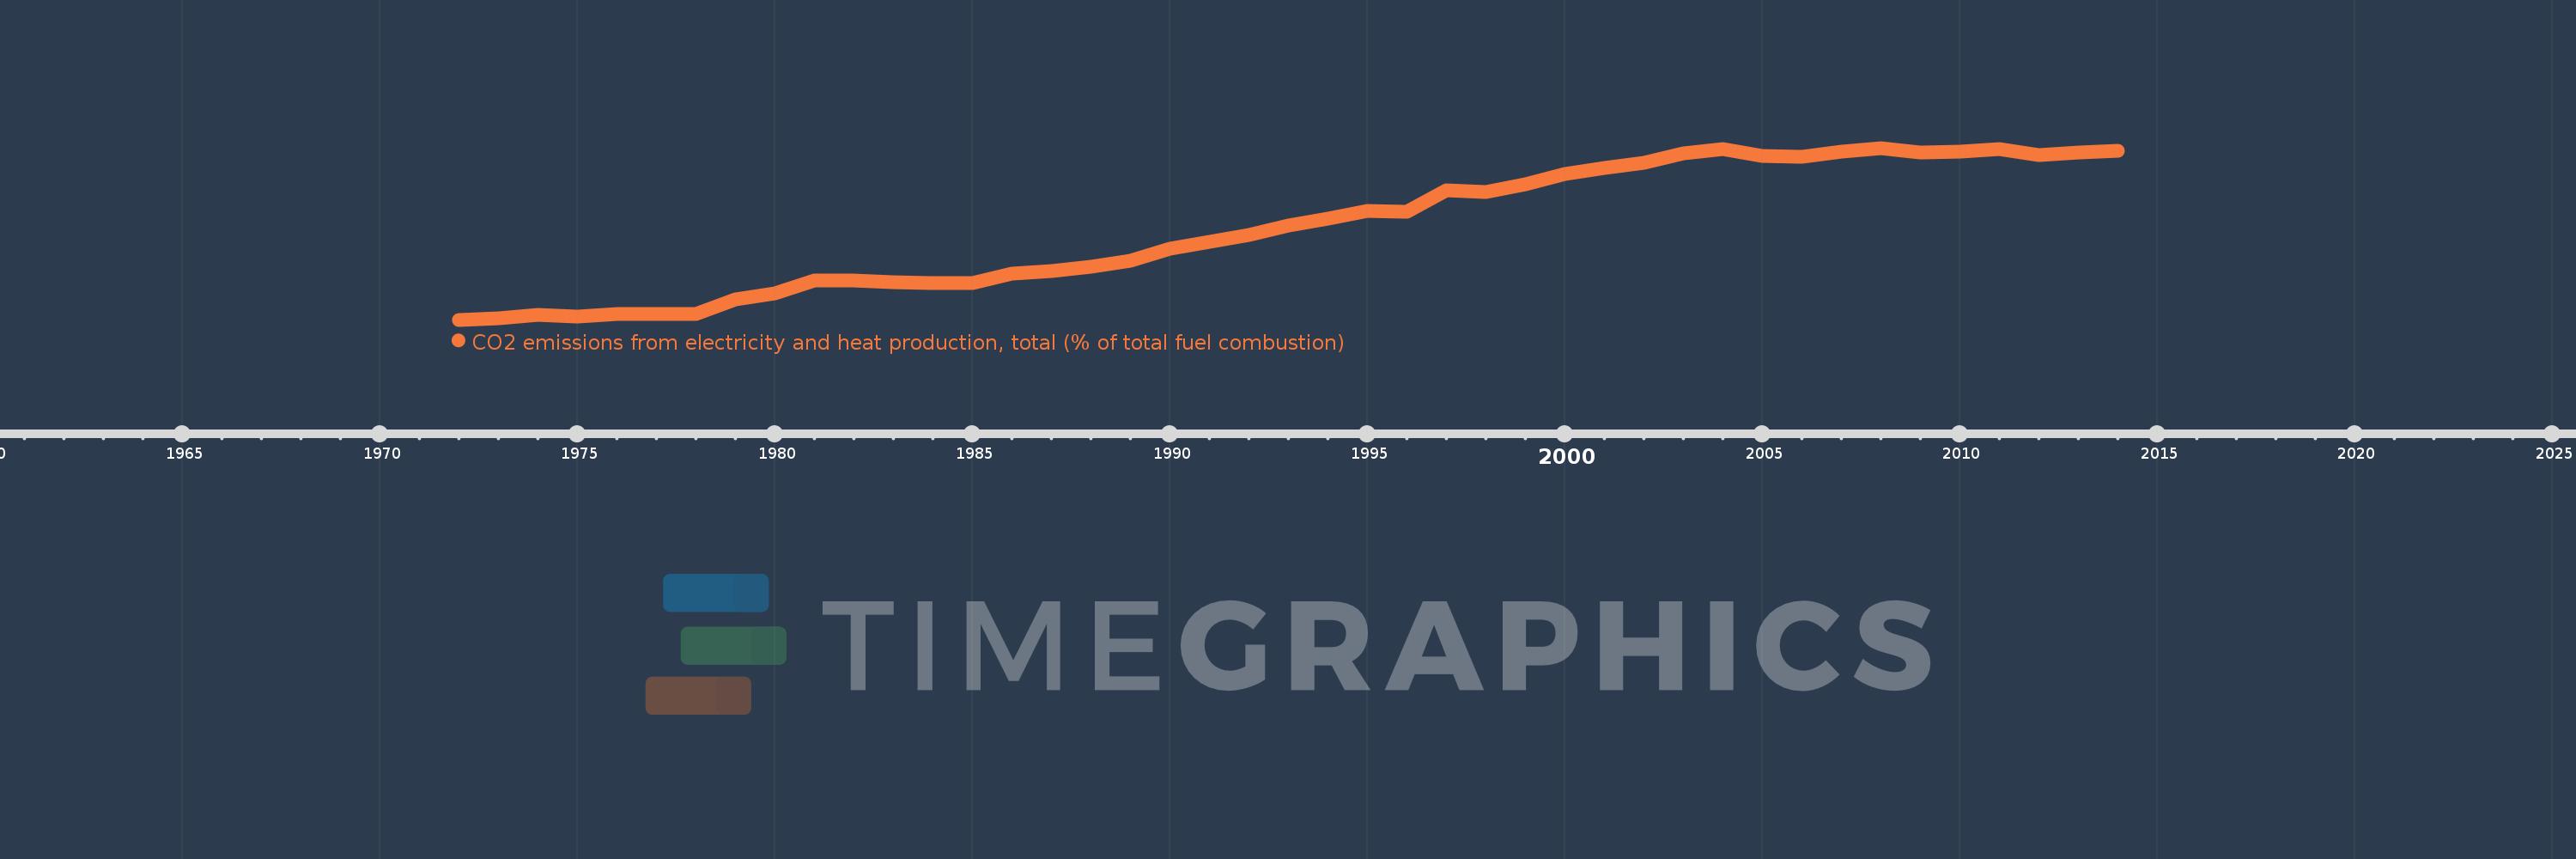
CO2 emissions from electricity and heat production, total (% of total fuel combustion)
2014,2013,2012,2011,2010,2009,2008,2007,2006,2005,2004,2003,2002,2001,2000,1999,1998,1997,1996,1995,1994,1993,1992,1991,1990,1989,1988,1987,1986,1985,1984,1983,1982,1981,1980,1979,1978,1977,1976,1975,1974,1973,1972
Estas estadísticas en otros países:
AlbaniaAlgeriaAngolaArab WorldArgentinaArmeniaAustraliaAustriaAzerbaijanBahrainBangladeshBelarusBelgiumBeninBoliviaBosnia and HerzegovinaBotswanaBrazilBrunei DarussalamBulgariaCambodiaCameroonCanadaCaribbean small statesCentral Europe and the BalticsChileChinaColombiaCongo, Dem. Rep.Congo, Rep.Costa RicaCote d'IvoireCroatiaCubaCuracaoCyprusCzech RepublicDenmarkDominican RepublicEarly-demographic dividendEast Asia & PacificEast Asia & Pacific (excluding high income)East Asia & Pacific (IDA & IBRD countries)EcuadorEgypt, Arab Rep.El SalvadorEritreaEstoniaEthiopiaEuro areaEurope & Central AsiaEurope & Central Asia (excluding high income)Europe & Central Asia (IDA & IBRD countries)European UnionFinlandFragile and conflict affected situationsFranceGabonGeorgiaGermanyGhanaGibraltarGreeceGuatemalaHaitiHeavily indebted poor countries (HIPC)High incomeHondurasHong Kong SAR, ChinaHungaryIBRD onlyIcelandIDA & IBRD totalIDA blendIDA onlyIDA totalIndiaIndonesiaIran, Islamic Rep.IraqIrelandIsraelItalyJamaicaJapanJordanKazakhstanKenyaKorea, Dem. People’s Rep.Korea, Rep.KosovoKuwaitKyrgyz RepublicLate-demographic dividendLatin America & Caribbean Latin America & Caribbean (excluding high income)Latin America & the Caribbean (IDA & IBRD countries)LatviaLeast developed countries: UN classificationLebanonLibyaLithuaniaLow & middle incomeLow incomeLower middle incomeLuxembourgMacedonia, FYRMalaysiaMaltaMauritiusMexicoMiddle East & North AfricaMiddle East & North Africa (excluding high income)Middle East & North Africa (IDA & IBRD countries)Middle incomeMoldovaMongoliaMontenegroMoroccoMozambiqueMyanmarNamibiaNepalNetherlandsNew ZealandNicaraguaNigerNigeriaNorth AmericaNorwayOECD membersOmanOther small statesPakistanPanamaParaguayPeruPhilippinesPolandPortugalPost-demographic dividendPre-demographic dividendQatarRomaniaRussian FederationSaudi ArabiaSenegalSerbiaSingaporeSlovak RepublicSloveniaSmall statesSouth AfricaSouth AsiaSouth Asia (IDA & IBRD)South SudanSpainSri LankaSub-Saharan Africa Sub-Saharan Africa (excluding high income)Sub-Saharan Africa (IDA & IBRD countries)SudanSwedenSwitzerlandSyrian Arab RepublicTajikistanTanzaniaThailandTogoTrinidad and TobagoTunisiaTurkeyTurkmenistanUkraineUnited Arab EmiratesUnited KingdomUnited StatesUpper middle incomeUruguayUzbekistanVenezuela, RBVietnamWorldYemen, Rep.ZambiaZimbabwe línea de tiempo (timeline):
En esta escala de tiempo se presenta un gráfico de 1972 y 2014 de China. Los datos de 1971 están ausentes. El número de observaciones reales por fecha: 43.
Fuente (nombre):
Indicadores del desarrollo mundial
Fuente (organización):
IEA Statistics © OECD/IEA 2014 (http://www.iea.org/stats/index.asp), subject to https://www.iea.org/t&c/termsandconditions/
Categorías:
Environment
Se ha actualizado:
23 abr 2017 año
Los indicadores de los cambios de valor en los últimos años
Mínimo:
16.304
1 ene 1972 año
Máximo:
53.503
1 ene 2008 año
A la fecha de observación
Valor
Cambio absoluto
El cambio con respecto al valor anterior
1 ene 1972 año
16.304
+16.304
0.0%
1 ene 1973 año
16.618
+0.314
1.92%
1 ene 1974 año
17.351
+0.734
4.42%
1 ene 1975 año
16.921
-0.43
-2.48%
1 ene 1976 año
17.582
+0.662
3.91%
1 ene 1977 año
17.577
-0.006
-0.03%
1 ene 1978 año
17.557
-0.02
-0.11%
1 ene 1979 año
20.65
+3.093
17.62%
1 ene 1980 año
22.059
+1.409
6.82%
1 ene 1981 año
24.895
+2.836
12.86%
1 ene 1982 año
24.785
-0.11
-0.44%
1 ene 1983 año
24.481
-0.304
-1.23%
1 ene 1984 año
24.265
-0.216
-0.88%
1 ene 1985 año
24.203
-0.062
-0.25%
1 ene 1986 año
26.371
+2.167
8.95%
1 ene 1987 año
26.94
+0.569
2.16%
1 ene 1988 año
27.855
+0.915
3.4%
1 ene 1989 año
29.037
+1.182
4.24%
1 ene 1990 año
31.643
+2.606
8.98%
1 ene 1991 año
33.224
+1.581
5.0%
1 ene 1992 año
34.63
+1.407
4.23%
1 ene 1993 año
36.619
+1.989
5.74%
1 ene 1994 año
38.209
+1.59
4.34%
1 ene 1995 año
39.835
+1.626
4.26%
1 ene 1996 año
39.755
-0.08
-0.2%
1 ene 1997 año
44.386
+4.631
11.65%
1 ene 1998 año
44.039
-0.348
-0.78%
1 ene 1999 año
45.573
+1.534
3.48%
1 ene 2000 año
47.815
+2.242
4.92%
1 ene 2001 año
49.113
+1.297
2.71%
1 ene 2002 año
50.196
+1.083
2.21%
1 ene 2003 año
52.391
+2.195
4.37%
1 ene 2004 año
53.233
+0.842
1.61%
1 ene 2005 año
51.842
-1.391
-2.61%
1 ene 2006 año
51.528
-0.314
-0.61%
1 ene 2007 año
52.745
+1.217
2.36%
1 ene 2008 año
53.503
+0.758
1.44%
1 ene 2009 año
52.443
-1.06
-1.98%
1 ene 2010 año
52.73
+0.287
0.55%
1 ene 2011 año
53.189
+0.459
0.87%
1 ene 2012 año
51.943
-1.245
-2.34%
1 ene 2013 año
52.517
+0.574
1.1%
1 ene 2014 año
52.952
+0.435
0.83%
Ranking de los países por los datos estadísticos actuales


Comentarios: